## Line Graphs: Accuracy vs. Sparsity Across Datasets
### Overview
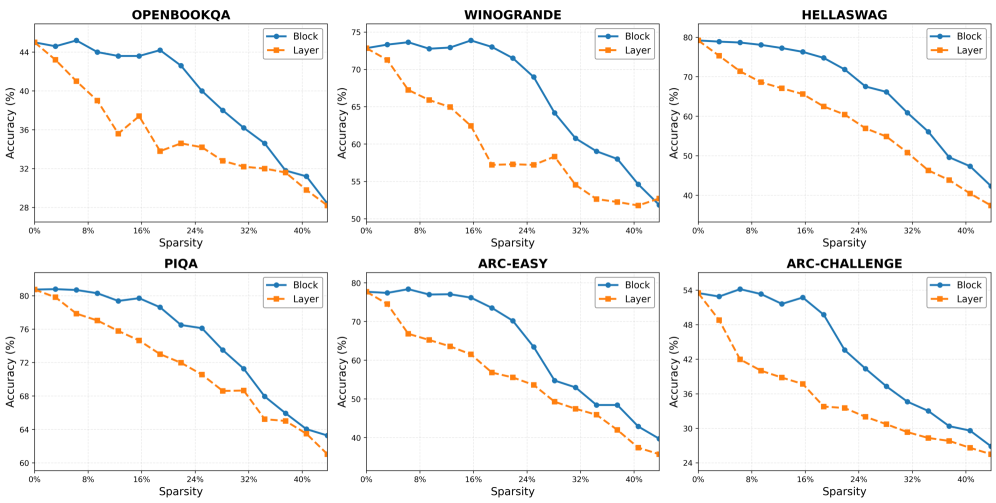
The image contains six line graphs comparing the accuracy of two model configurations ("Block" and "Layer") across six datasets as sparsity increases from 0% to 40%. Each graph plots accuracy (%) on the y-axis against sparsity (%) on the x-axis. The datasets are: OPENBOOKQA, WINOGRANDE, HELLASWAG, PIQA, ARC-EASY, and ARC-CHALLENGE.
### Components/Axes
- **X-axis**: Labeled "Sparsity (%)" with markers at 0%, 8%, 16%, 24%, 32%, and 40%.
- **Y-axis**: Labeled "Accuracy (%)" with scales varying by dataset (e.g., 20–45% for OPENBOOKQA, 50–80% for HELLASWAG).
- **Legends**: Positioned at the top-right of each graph, with "Block" (blue line) and "Layer" (orange line) labels.
- **Titles**: Dataset names (e.g., "OPENBOOKQA") centered at the top of each graph.
### Detailed Analysis
#### OPENBOOKQA
- **Block**: Starts at ~44% accuracy (0% sparsity), declines steadily to ~28% (40% sparsity).
- **Layer**: Begins at ~44% (0% sparsity), drops sharply to ~28% (40% sparsity), with a plateau at ~32% between 8%–16% sparsity.
#### WINOGRANDE
- **Block**: Starts at ~75% (0% sparsity), declines to ~55% (40% sparsity), with minor fluctuations.
- **Layer**: Begins at ~75% (0% sparsity), drops to ~50% (40% sparsity), with a steeper decline after 24% sparsity.
#### HELLASWAG
- **Block**: Starts at ~80% (0% sparsity), declines to ~50% (40% sparsity), with a gradual slope.
- **Layer**: Begins at ~80% (0% sparsity), drops to ~40% (40% sparsity), with a consistent downward trend.
#### PIQA
- **Block**: Starts at ~80% (0% sparsity), declines to ~60% (40% sparsity), with a plateau at ~72% between 8%–16% sparsity.
- **Layer**: Begins at ~80% (0% sparsity), drops to ~55% (40% sparsity), with a sharp decline after 24% sparsity.
#### ARC-EASY
- **Block**: Starts at ~80% (0% sparsity), declines to ~40% (40% sparsity), with a steady slope.
- **Layer**: Begins at ~80% (0% sparsity), drops to ~30% (40% sparsity), with a plateau at ~50% between 8%–16% sparsity.
#### ARC-CHALLENGE
- **Block**: Starts at ~55% (0% sparsity), declines to ~30% (40% sparsity), with a gradual slope.
- **Layer**: Begins at ~55% (0% sparsity), drops to ~25% (40% sparsity), with a steeper decline after 16% sparsity.
### Key Observations
1. **Consistent Decline**: All datasets show reduced accuracy as sparsity increases, with no exceptions.
2. **Block vs. Layer**: "Block" configurations consistently outperform "Layer" across all datasets and sparsity levels.
3. **Steepest Declines**: "Layer" models exhibit sharper accuracy drops, particularly in HELLASWAG and ARC-CHALLENGE.
4. **Plateaus**: Some datasets (e.g., PIQA, ARC-EASY) show temporary stability in accuracy for "Layer" models at mid-sparsity levels.
### Interpretation
The data demonstrates that "Block" models maintain higher robustness to sparsity compared to "Layer" models. This suggests architectural advantages in "Block" configurations for handling sparse data, which is critical for applications requiring efficient, parameter-reduced models. The steeper declines in "Layer" models highlight their sensitivity to sparsity, potentially due to reliance on dense interconnections. Notably, datasets like HELLASWAG and ARC-CHALLENGE show the largest performance gaps between configurations, indicating higher vulnerability to sparsity in complex tasks. The plateaus observed in some datasets may reflect optimization challenges or architectural trade-offs in maintaining performance under moderate sparsity.