## Chart: Delta P vs Layer for Mistral-7B-Instruct Models
### Overview
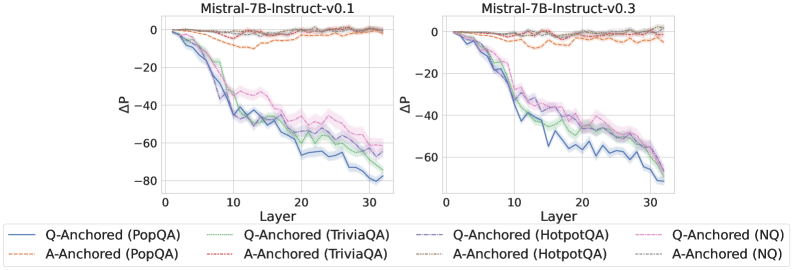
The image contains two line charts comparing the performance of Mistral-7B-Instruct models (v0.1 and v0.3) across different layers. The charts plot the change in performance (ΔP) against the layer number. Each chart displays six data series, representing different question-answering tasks, anchored either by question (Q-Anchored) or answer (A-Anchored).
### Components/Axes
* **Titles:**
* Left Chart: "Mistral-7B-Instruct-v0.1"
* Right Chart: "Mistral-7B-Instruct-v0.3"
* **Y-Axis (ΔP):** Both charts share the same Y-axis, labeled "ΔP". The scale ranges from -80 to 0, with tick marks at -60, -40, -20, and 0.
* **X-Axis (Layer):** Both charts share the same X-axis, labeled "Layer". The scale ranges from 0 to 30, with tick marks at 0, 10, 20, and 30.
* **Legend:** Located below the charts, the legend identifies the six data series:
* Q-Anchored (PopQA): Solid blue line
* A-Anchored (PopQA): Dashed brown line
* Q-Anchored (TriviaQA): Dotted green line
* A-Anchored (TriviaQA): Dotted-dashed grey line
* Q-Anchored (HotpotQA): Dotted-dashed pink line
* A-Anchored (HotpotQA): Dotted grey line
* Q-Anchored (NQ): Dashed-dotted pink line
* A-Anchored (NQ): Dotted grey line
### Detailed Analysis
**Left Chart (Mistral-7B-Instruct-v0.1):**
* **Q-Anchored (PopQA):** (Solid blue line) Starts at approximately 0 and decreases to approximately -75 by layer 30. The line shows a downward trend.
* **A-Anchored (PopQA):** (Dashed brown line) Remains relatively stable around 0 throughout all layers.
* **Q-Anchored (TriviaQA):** (Dotted green line) Starts at approximately 0 and decreases to approximately -60 by layer 30. The line shows a downward trend.
* **A-Anchored (TriviaQA):** (Dotted-dashed grey line) Remains relatively stable around 0 throughout all layers.
* **Q-Anchored (HotpotQA):** (Dotted-dashed pink line) Starts at approximately 0 and decreases to approximately -50 by layer 30. The line shows a downward trend.
* **A-Anchored (HotpotQA):** (Dotted grey line) Remains relatively stable around 0 throughout all layers.
* **Q-Anchored (NQ):** (Dashed-dotted pink line) Starts at approximately 0 and decreases to approximately -50 by layer 30. The line shows a downward trend.
* **A-Anchored (NQ):** (Dotted grey line) Remains relatively stable around 0 throughout all layers.
**Right Chart (Mistral-7B-Instruct-v0.3):**
* **Q-Anchored (PopQA):** (Solid blue line) Starts at approximately 0 and decreases to approximately -80 by layer 30. The line shows a downward trend.
* **A-Anchored (PopQA):** (Dashed brown line) Remains relatively stable around 0 throughout all layers.
* **Q-Anchored (TriviaQA):** (Dotted green line) Starts at approximately 0 and decreases to approximately -65 by layer 30. The line shows a downward trend.
* **A-Anchored (TriviaQA):** (Dotted-dashed grey line) Remains relatively stable around 0 throughout all layers.
* **Q-Anchored (HotpotQA):** (Dotted-dashed pink line) Starts at approximately 0 and decreases to approximately -55 by layer 30. The line shows a downward trend.
* **A-Anchored (HotpotQA):** (Dotted grey line) Remains relatively stable around 0 throughout all layers.
* **Q-Anchored (NQ):** (Dashed-dotted pink line) Starts at approximately 0 and decreases to approximately -55 by layer 30. The line shows a downward trend.
* **A-Anchored (NQ):** (Dotted grey line) Remains relatively stable around 0 throughout all layers.
### Key Observations
* **Downward Trend for Q-Anchored Series:** All Q-Anchored series (PopQA, TriviaQA, HotpotQA, NQ) show a clear downward trend in both charts, indicating a decrease in performance as the layer number increases.
* **Stable A-Anchored Series:** All A-Anchored series (PopQA, TriviaQA, HotpotQA, NQ) remain relatively stable around 0, suggesting that anchoring by the answer results in consistent performance across layers.
* **Similar Performance Between Versions:** The performance trends are similar between Mistral-7B-Instruct-v0.1 and Mistral-7B-Instruct-v0.3, with v0.3 showing slightly lower values for Q-Anchored series at layer 30.
### Interpretation
The data suggests that anchoring by the question (Q-Anchored) leads to a degradation in performance as the model processes deeper layers. This could be due to the model losing focus on the original question or accumulating errors as it progresses through the layers. In contrast, anchoring by the answer (A-Anchored) maintains a stable performance, possibly because the model is consistently guided by the correct answer. The slight performance difference between v0.1 and v0.3 for Q-Anchored series may indicate minor architectural or training differences between the two versions. The consistent behavior of A-anchored series suggests that the model is more robust when the answer is provided as a reference point.