## Diagram: Causal Network and Irreducible Distinctions
### Overview
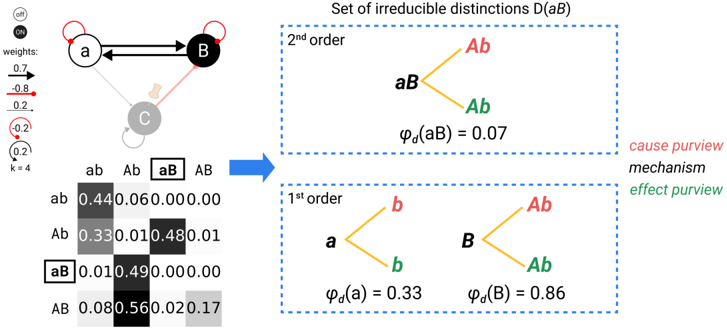
The image depicts a causal network with three nodes (a, b, and c) and their interactions, alongside a representation of irreducible distinctions between variables a and B. The network's weights are visualized, and a matrix shows the probabilities of different state combinations. The right side of the image illustrates the "Set of irreducible distinctions D(aB)" with a hierarchical structure (1st and 2nd order) and associated probabilities. A blue arrow connects the network to the distinction set.
### Components/Axes
The diagram consists of three main sections:
1. **Causal Network:** Nodes labeled 'a', 'b', and 'c'. Arrows indicate causal relationships with weights. A scale on the left shows the weight mapping (0.2 to -0.8).
2. **Probability Matrix:** A 4x4 matrix with row and column labels: 'ab', 'Ab', 'aB', 'AB'. The matrix contains numerical values representing probabilities.
3. **Irreducible Distinctions:** A boxed area labeled "Set of irreducible distinctions D(aB)". This section is divided into "2nd order" and "1st order" subsections, each containing diagrams and probability values. A legend on the right defines color-coding for "cause purview", "mechanism", and "effect purview".
### Detailed Analysis or Content Details
**Causal Network:**
* Node 'a' is black, Node 'b' is black, and Node 'c' is grey.
* An arrow points from 'a' to 'b' with a weight of approximately -0.8.
* An arrow points from 'a' to 'c' with a weight of approximately 0.2.
* An arrow points from 'c' to 'b' with a weight of approximately 0.2.
**Probability Matrix:**
The matrix values are as follows (row = first variable, column = second variable):
* ab: 0.440, 0.060, 0.000, 0.000
* Ab: 0.330, 0.100, 0.480, 0.000
* aB: 0.010, 0.490, 0.000, 0.000
* AB: 0.080, 0.560, 0.020, 0.170
**Irreducible Distinctions:**
* **2nd Order:** Two arrows labeled 'Ab' (red) point upwards. The probability φ<sub>d</sub>(aB) = 0.07 is given.
* **1st Order:**
* An arrow labeled 'a' (red) points downwards, and an arrow labeled 'b' (red) points downwards.
* An arrow labeled 'Ab' (red) points to the right.
* An arrow labeled 'B' (red) points downwards, and an arrow labeled 'Ab' (red) points to the right.
* The probability φ<sub>d</sub>(a) = 0.33 is given.
* The probability φ<sub>d</sub>(B) = 0.86 is given.
**Legend:**
* Cause purview: Red
* Mechanism: Blue
* Effect purview: Green
### Key Observations
* The causal network shows a strong negative influence from 'a' to 'b' and weaker positive influences from 'a' to 'c' and 'c' to 'b'.
* The probability matrix shows that the combination 'ab' has the highest probability (0.440), while 'AB' has a non-negligible probability (0.170).
* The irreducible distinctions section highlights the importance of 'B' (φ<sub>d</sub>(B) = 0.86) compared to 'a' (φ<sub>d</sub>(a) = 0.33) in distinguishing aB.
* The 2nd order distinctions have a much lower probability (0.07) than the 1st order distinctions.
### Interpretation
This diagram illustrates a causal model and its decomposition into irreducible distinctions. The network represents a system where 'a' directly influences 'b' and 'c', and 'c' influences 'b'. The probability matrix quantifies the likelihood of different states of 'a' and 'b' occurring. The irreducible distinctions section, D(aB), aims to identify the minimal set of distinctions needed to differentiate between 'a' and 'B'. The higher probability associated with φ<sub>d</sub>(B) suggests that 'B' is a more significant factor in distinguishing 'aB' than 'a' itself. The hierarchical structure of the irreducible distinctions (1st and 2nd order) suggests a refinement process, where the 1st order distinctions provide a broader separation, and the 2nd order distinctions offer a more nuanced understanding. The color-coding (cause, mechanism, effect) helps to understand the flow of influence within the system. The diagram suggests a system where the effect of 'a' on 'b' is mediated by 'c', and the distinction between 'a' and 'B' is primarily driven by the state of 'B'.