\n
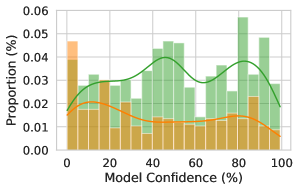
## Histogram with Density Curves: Model Confidence vs. Proportion
### Overview
The image presents a histogram displaying the distribution of "Model Confidence" (in percentage) against "Proportion" (also in percentage). Two overlaid density curves are plotted on top of the histogram, representing different categories or groups within the data. The histogram bars are colored in shades of green and orange.
### Components/Axes
* **X-axis:** "Model Confidence (%)" ranging from 0 to 100, with tick marks at intervals of 20.
* **Y-axis:** "Proportion (%)" ranging from 0.00 to 0.06, with tick marks at intervals of 0.01.
* **Histogram Bars:** Represent the frequency distribution of model confidence values. The bars are colored in green and orange.
* **Density Curve 1 (Green):** A smooth curve overlaid on the histogram, likely representing the density estimate for one group.
* **Density Curve 2 (Orange):** Another smooth curve overlaid on the histogram, representing the density estimate for a different group.
* **Legend:** There is no explicit legend, but the colors of the curves and histogram bars suggest two distinct groups.
### Detailed Analysis
The histogram shows the distribution of model confidence scores. The x-axis represents the confidence level, and the y-axis represents the proportion of instances with that confidence level.
**Green Histogram & Density Curve:**
The green histogram bars and density curve represent a larger proportion of the data. The distribution appears to be unimodal, peaking around a model confidence of approximately 40-60%. The curve rises from the left, reaches a peak, and then gradually declines towards the right.
* At 0% Model Confidence, the proportion is approximately 0.005.
* At 20% Model Confidence, the proportion is approximately 0.025.
* At 40% Model Confidence, the proportion is approximately 0.045.
* At 60% Model Confidence, the proportion is approximately 0.035.
* At 80% Model Confidence, the proportion is approximately 0.038.
* At 100% Model Confidence, the proportion is approximately 0.02.
**Orange Histogram & Density Curve:**
The orange histogram bars and density curve represent a smaller proportion of the data. The distribution is also unimodal, but with a peak around a lower model confidence, approximately 0-20%. The curve rises quickly, reaches a peak, and then declines more rapidly than the green curve.
* At 0% Model Confidence, the proportion is approximately 0.045.
* At 20% Model Confidence, the proportion is approximately 0.018.
* At 40% Model Confidence, the proportion is approximately 0.012.
* At 60% Model Confidence, the proportion is approximately 0.008.
* At 80% Model Confidence, the proportion is approximately 0.005.
* At 100% Model Confidence, the proportion is approximately 0.002.
### Key Observations
* The green distribution has a higher peak and a wider spread than the orange distribution.
* The orange distribution is concentrated at lower confidence levels.
* There is a noticeable overlap between the two distributions, particularly in the 20-60% confidence range.
* The green density curve generally has higher proportions than the orange density curve across most of the confidence range.
### Interpretation
The data suggests that the model generally exhibits higher confidence levels, as indicated by the dominant green distribution. However, there is a significant portion of predictions with lower confidence, represented by the orange distribution. The two distributions likely represent different subsets of the data or different types of predictions made by the model. The higher proportion of predictions with higher confidence suggests the model is performing reasonably well overall, but the presence of the lower-confidence predictions indicates areas where the model may struggle or require further refinement. The overlap between the distributions suggests that there are instances where the model is uncertain, and its predictions fall within a range of confidence levels. The shape of the curves suggests that the model is more likely to be very confident or very unconfident, with fewer predictions falling in the middle range.