## Histogram: First Correct Answer Emergence
### Overview
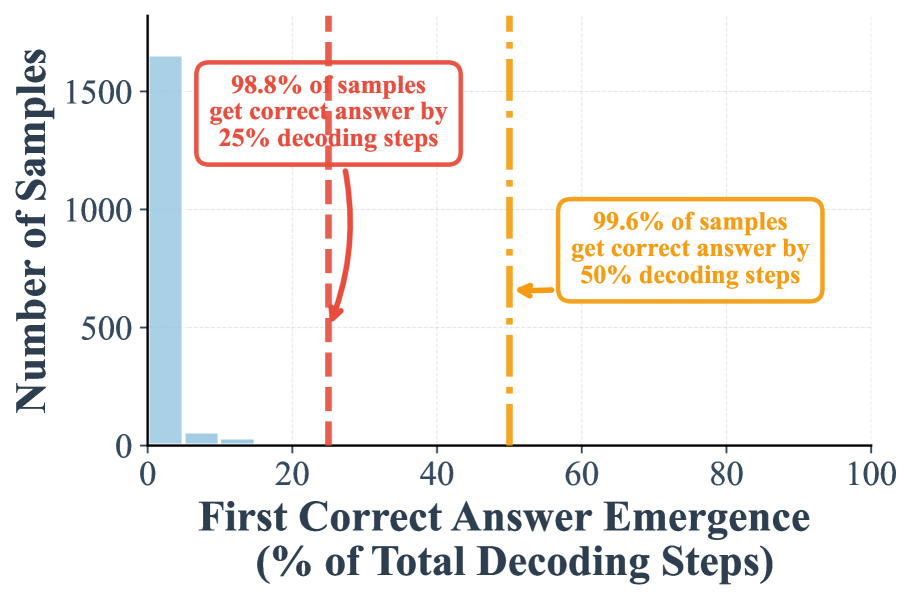
The image is a histogram showing the distribution of the "First Correct Answer Emergence" as a percentage of total decoding steps. The x-axis represents the percentage of total decoding steps, and the y-axis represents the number of samples. The histogram shows that a large number of samples get the correct answer very early in the decoding process. Two vertical lines indicate the percentage of samples that get the correct answer by 25% and 50% of the decoding steps.
### Components/Axes
* **X-axis:** "First Correct Answer Emergence (% of Total Decoding Steps)". The axis ranges from 0 to 100 with tick marks at intervals of 20 (0, 20, 40, 60, 80, 100).
* **Y-axis:** "Number of Samples". The axis ranges from 0 to 1500 with tick marks at intervals of 500 (0, 500, 1000, 1500).
* **Bars:** Light blue bars represent the number of samples for each percentage range of the first correct answer emergence.
* **Vertical Lines:**
* Red dashed line at approximately x=25, indicating that 98.8% of samples get the correct answer by 25% decoding steps.
* Orange dashed-dotted line at approximately x=50, indicating that 99.6% of samples get the correct answer by 50% decoding steps.
### Detailed Analysis
* The histogram is heavily skewed to the left, with the vast majority of samples (approximately 1600) achieving the first correct answer emergence within the first 0-5% of total decoding steps.
* The number of samples decreases rapidly as the percentage of decoding steps increases.
* At 25% of decoding steps, 98.8% of samples have already achieved the correct answer. This is indicated by a red dashed vertical line and a text annotation.
* At 50% of decoding steps, 99.6% of samples have achieved the correct answer. This is indicated by an orange dashed-dotted vertical line and a text annotation.
### Key Observations
* The model achieves a high percentage of correct answers very early in the decoding process.
* The marginal gain in correct answers from 25% to 50% decoding steps is relatively small (98.8% to 99.6%).
### Interpretation
The data suggests that the model is highly efficient in finding the correct answer. A large majority of samples converge to the correct answer within a small fraction of the total decoding steps. The fact that 98.8% of samples get the correct answer by 25% decoding steps indicates that the model quickly identifies the relevant information and converges to the solution. The additional 0.8% of samples that get the correct answer between 25% and 50% decoding steps may represent more complex or ambiguous cases that require more processing. Overall, the histogram demonstrates the model's ability to efficiently and accurately decode information.