\n
## Histogram: First Correct Answer Emergence
### Overview
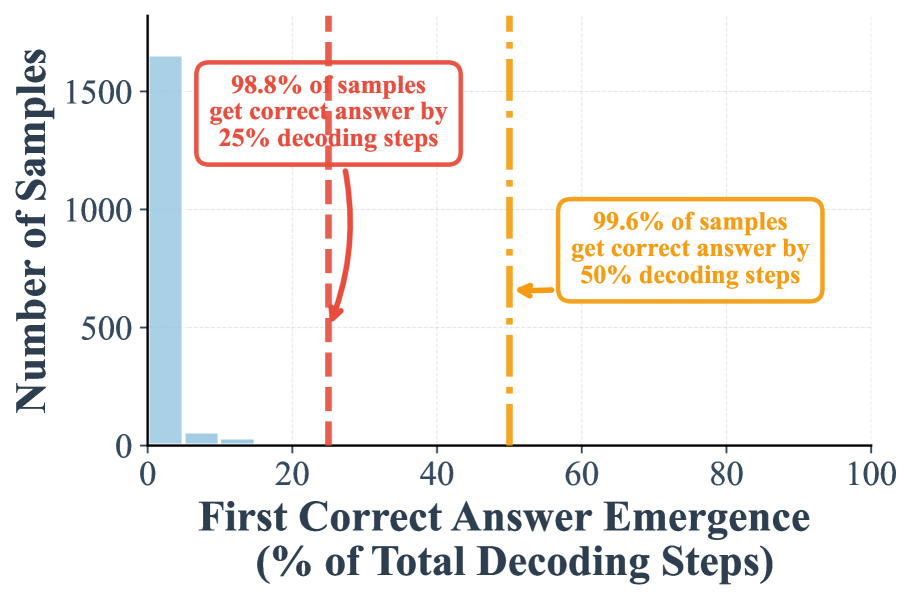
The image presents a histogram illustrating the distribution of the percentage of total decoding steps required for a model to produce its first correct answer. The y-axis represents the number of samples, while the x-axis represents the percentage of total decoding steps. Two vertical dashed lines highlight key thresholds: 25% and 50% decoding steps, with associated percentages of samples achieving a correct answer.
### Components/Axes
* **X-axis Title:** "First Correct Answer Emergence (% of Total Decoding Steps)" - Scale ranges from 0 to 100.
* **Y-axis Title:** "Number of Samples" - Scale ranges from 0 to 1500, with increments of 200.
* **Annotation 1 (Red):** Located near x=20, states "98.8% of samples get correct answer by 25% decoding steps". A vertical dashed red line is positioned at approximately 20 on the x-axis.
* **Annotation 2 (Yellow):** Located near x=50, states "99.6% of samples get correct answer by 50% decoding steps". A vertical dashed yellow line is positioned at approximately 50 on the x-axis.
* **Histogram Bars:** Light blue bars representing the frequency distribution of samples.
### Detailed Analysis
The histogram shows a strong skew towards lower percentages of decoding steps. The majority of samples achieve a correct answer with a relatively small number of decoding steps.
* **0-20% Decoding Steps:** A large number of samples (approximately 1400) achieve a correct answer within the first 20% of decoding steps.
* **20-50% Decoding Steps:** The number of samples decreases significantly, but still remains substantial (approximately 500).
* **50-100% Decoding Steps:** Very few samples require more than 50% of the total decoding steps to produce a correct answer. The number of samples is very low, approaching zero.
Specifically:
* At approximately 20% decoding steps, the histogram reaches a peak, and 98.8% of samples have a correct answer.
* At approximately 50% decoding steps, 99.6% of samples have a correct answer.
### Key Observations
* The data demonstrates a rapid convergence towards correct answers. The vast majority of samples achieve a correct answer within the first 50% of decoding steps.
* The distribution is heavily skewed to the left, indicating that most samples require a small percentage of decoding steps.
* There is a minimal number of samples that require a large percentage of decoding steps to achieve a correct answer.
### Interpretation
The data suggests that the model is highly efficient in generating correct answers. It quickly converges on the correct solution, with a very small percentage of samples requiring a significant number of decoding steps. This could indicate a well-trained model with a strong understanding of the task. The annotations highlight the efficiency, showing that nearly all samples (98.8% and 99.6%) achieve a correct answer within a relatively short period of decoding. The difference between the two thresholds (25% and 50%) is minimal, suggesting that the marginal gain in accuracy beyond 25% decoding steps is small. This information is valuable for optimizing the decoding process and potentially reducing computational costs by limiting the number of decoding steps.