## Diagram: CPU Core Task Allocation Schemes
### Overview
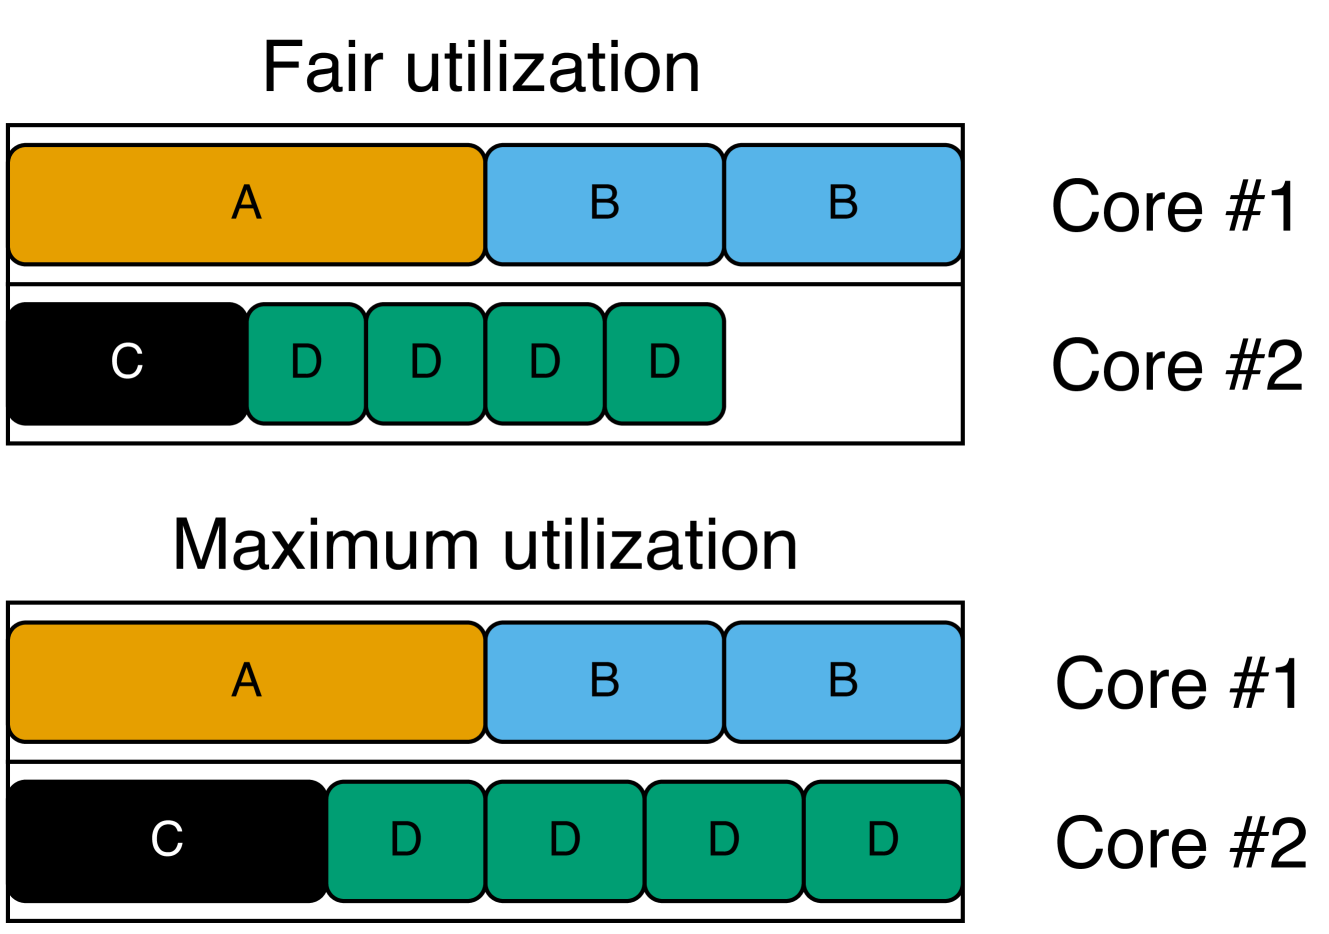
The image is a technical diagram illustrating two different task scheduling or resource allocation strategies on a dual-core processor. It visually compares "Fair utilization" and "Maximum utilization" by showing how tasks (labeled A, B, C, D) are distributed across Core #1 and Core #2. The diagram uses colored blocks to represent tasks and their relative execution time or resource consumption.
### Components/Axes
The diagram is divided into two primary horizontal sections, each with a title:
1. **Top Section Title:** "Fair utilization"
2. **Bottom Section Title:** "Maximum utilization"
Each section contains two horizontal rows representing processor cores:
* **Row Label (Right Side):** "Core #1" (top row in each section)
* **Row Label (Right Side):** "Core #2" (bottom row in each section)
**Task Blocks (Legend by Color and Label):**
* **Orange Block:** Labeled "A"
* **Light Blue Block:** Labeled "B"
* **Black Block:** Labeled "C"
* **Green Block:** Labeled "D"
### Detailed Analysis
**1. Fair utilization (Top Section):**
* **Core #1:** Contains three contiguous blocks. From left to right: one orange "A" block, followed by two light blue "B" blocks.
* **Core #2:** Contains five blocks with a visible gap. From left to right: one black "C" block, followed by four green "D" blocks. There is a significant empty white space to the right of the last "D" block, indicating idle time or unused capacity on Core #2.
**2. Maximum utilization (Bottom Section):**
* **Core #1:** Identical to the "Fair utilization" scheme. Contains one orange "A" block followed by two light blue "B" blocks.
* **Core #2:** Contains five contiguous blocks with no gaps. From left to right: one black "C" block, followed by four green "D" blocks. The blocks extend to the far right edge of the row, indicating the core is fully occupied with no idle time.
### Key Observations
* **Core #1 Consistency:** The task allocation for Core #1 (A, B, B) is identical in both utilization schemes.
* **Core #2 Variance:** The critical difference lies in Core #2. Under "Fair utilization," the four "D" tasks are scheduled with a gap, leaving the core underutilized. Under "Maximum utilization," the same "D" tasks are scheduled back-to-back, filling the core's timeline completely.
* **Task Composition:** The workload consists of one "A" task, two "B" tasks, one "C" task, and four "D" tasks, totaling eight discrete task units across two cores.
### Interpretation
This diagram demonstrates a fundamental trade-off in system scheduling between fairness and efficiency.
* **What it suggests:** The "Fair utilization" model likely represents a scheduling policy that prioritizes equitable access or prevents task starvation, potentially by inserting delays or time-slicing, which results in fragmented execution and idle core time (the gap on Core #2). The "Maximum utilization" model represents a policy focused on throughput and resource efficiency, packing tasks tightly to eliminate idle time, which may come at the cost of fairness or increased latency for some tasks.
* **Relationship between elements:** The identical layout of Core #1 implies that the scheduling policy change primarily affects how the "D" tasks (and possibly the "C" task) are handled on Core #2. The "D" tasks appear to be the variable element whose scheduling flexibility allows for the gap in one scheme and the tight packing in the other.
* **Notable implication:** The diagram visually argues that the "Maximum utilization" scheme achieves higher overall system throughput (less wasted time) by optimizing the schedule on Core #2, while the "Fair utilization" scheme sacrifices some efficiency, possibly to meet other quality-of-service or fairness guarantees. The choice between them depends on whether the system's goal is to maximize raw performance or ensure balanced resource access.