\n
## Scatter Plot: Model Performance Comparison
### Overview
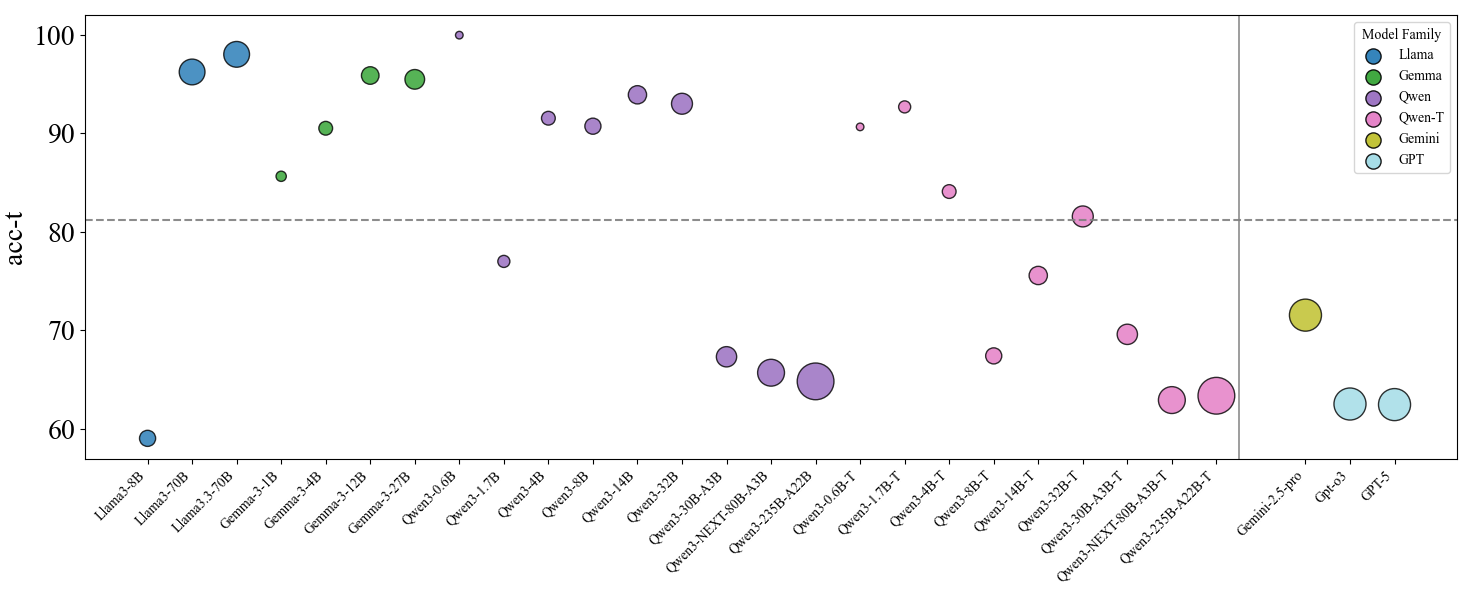
This scatter plot visualizes the performance (acc-t) of various language models across different sizes/configurations. The x-axis represents the model name, and the y-axis represents the accuracy score (acc-t). The size of each data point appears to correlate with some model parameter, potentially the number of parameters. Different colors represent different model families. A horizontal line at approximately acc-t = 80 is present, potentially indicating a performance threshold.
### Components/Axes
* **X-axis:** Model Name (Categorical) - Llama-3-8B, Llama-3-70B, Gemma-3-1B, Gemma-3-2B, Gemma-3-2B-it, Owen-1.0B, Owen-1.7B, Owen-3-4B, Owen-3-14B, Owen-5-32B, Owen-NEXT-80B-A1B, Owen-NEXT-25B-A2B, Owen-1.7B-T, Owen-3-4B-T, Owen-3-14B-T, Owen-5-32B-T, Owen-NEXT-80B-A1B-T, Owen-NEXT-25B-A2B-T, Gemini-2.5-pro, Qp6.3, GPT-5.
* **Y-axis:** acc-t (Accuracy) - Scale ranges from approximately 60 to 100.
* **Legend:** Located in the top-right corner.
* Llama (Blue)
* Gemini (Green)
* Qwen (Yellow)
* Owen-T (Red)
* GPT (Light Blue)
### Detailed Analysis
The plot shows a wide range of accuracy scores across different models. Here's a breakdown by model family, with approximate values based on visual inspection:
**Llama (Blue):**
* Llama-3-8B: acc-t ≈ 62
* Llama-3-70B: acc-t ≈ 83
* Trend: Llama performance increases with model size.
**Gemma (Green):**
* Gemma-3-1B: acc-t ≈ 81
* Gemma-3-2B: acc-t ≈ 82
* Gemma-3-2B-it: acc-t ≈ 78
* Trend: Gemma performance is relatively stable across the 1B and 2B models, with a slight dip for the Italian version.
**Qwen (Yellow):**
* Qwen-1.0B: acc-t ≈ 72
* Qwen-1.7B: acc-t ≈ 75
* Qwen-3-4B: acc-t ≈ 78
* Qwen-3-14B: acc-t ≈ 80
* Qwen-5-32B: acc-t ≈ 75
* Qwen-NEXT-80B-A1B: acc-t ≈ 72
* Qwen-NEXT-25B-A2B: acc-t ≈ 68
* Trend: Qwen performance initially increases with size, then plateaus and slightly decreases for the larger models.
**Owen-T (Red):**
* Owen-1.0B-T: acc-t ≈ 75
* Owen-1.7B-T: acc-t ≈ 78
* Owen-3-4B-T: acc-t ≈ 80
* Owen-3-14B-T: acc-t ≈ 76
* Owen-5-32B-T: acc-t ≈ 70
* Owen-NEXT-80B-A1B-T: acc-t ≈ 68
* Owen-NEXT-25B-A2B-T: acc-t ≈ 65
* Trend: Owen-T performance shows a more erratic pattern, with no clear correlation between size and accuracy.
**GPT (Light Blue):**
* Gemini-2.5-pro: acc-t ≈ 70
* Qp6.3: acc-t ≈ 64
* GPT-5: acc-t ≈ 61
* Trend: GPT models show relatively low performance compared to other families.
The horizontal line at acc-t ≈ 80 seems to separate models that achieve relatively high performance from those that do not.
### Key Observations
* Llama-3-70B and Gemma-3-2B achieve the highest accuracy scores.
* The larger Qwen and Owen-T models do not necessarily outperform their smaller counterparts.
* GPT models consistently show lower accuracy scores.
* There is significant variance in performance within each model family.
* The size of the data points appears to be correlated with model size, with larger points representing larger models.
### Interpretation
This data suggests that model size is not the sole determinant of performance. While larger Llama models generally perform better, this is not the case for Qwen or Owen-T. The architecture and training data likely play a significant role. The horizontal line at acc-t = 80 could represent a practical threshold for acceptable performance in a given application. The relatively low performance of GPT models may indicate that they are not as well-suited for the task being evaluated, or that they are smaller models compared to the others. The erratic performance of Owen-T models suggests that there may be issues with their training or architecture. The plot highlights the importance of evaluating models based on their specific performance metrics rather than relying solely on model size as an indicator of quality. The varying sizes of the data points, presumably representing model parameters, suggest a trade-off between model complexity and performance.