\n
## Diagram: Directed Acyclic Graph
### Overview
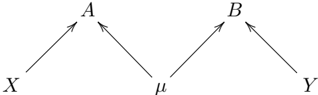
The image depicts a directed acyclic graph (DAG) with five nodes labeled X, A, B, Y, and μ (mu). Arrows indicate the direction of relationships between the nodes. The graph appears to represent a causal or probabilistic model.
### Components/Axes
The diagram consists of the following components:
* **Nodes:** X, A, B, Y, μ
* **Edges (Arrows):**
* X → A
* A → μ
* B → μ
* B → Y
### Detailed Analysis or Content Details
The graph shows the following relationships:
* X influences A.
* A influences μ.
* B influences μ.
* B influences Y.
* μ is influenced by both A and B.
* Y is influenced by B.
There are no numerical values or scales present in the diagram. The diagram is purely structural, representing relationships rather than quantitative data.
### Key Observations
* μ acts as a common effect of A and B, suggesting a potential confounding variable or a point of interaction.
* B has two outgoing edges, influencing both μ and Y, making it a central node in the graph.
* X and Y are terminal nodes, only having outgoing edges.
* The graph is acyclic, meaning there are no closed loops or cycles.
### Interpretation
This diagram likely represents a causal model or a Bayesian network. The nodes represent variables, and the arrows represent direct dependencies. The structure suggests that X and B are independent causes influencing μ, and B also directly influences Y. The graph could be used to model the relationships between these variables and to make inferences about their probabilities. The symbol μ (mu) is often used to represent a mean or expected value in statistics, suggesting that it might represent a central tendency or summary statistic. The diagram does not provide any information about the strength of the relationships or the nature of the variables themselves, only their structural dependencies. It is a qualitative representation of relationships, not a quantitative one.