## Scatter Plot: Accuracy vs. Time-to-Answer (Longest Thinking in Thousands)
### Overview
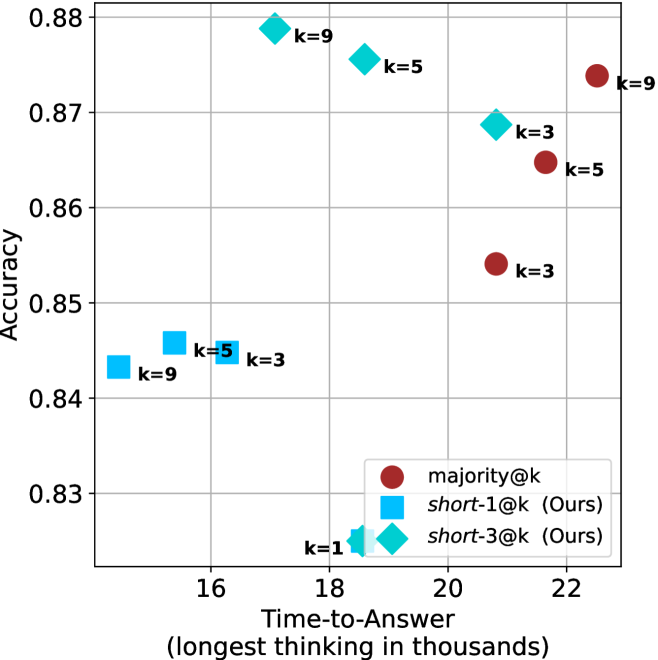
The image is a scatter plot comparing **accuracy** (y-axis) and **time-to-answer** (x-axis, in thousands of units) for three distinct methods: `majority@k`, `short-1@k`, and `short-3@k`. Data points are color-coded and labeled with `k` values (1, 3, 5, 9). The plot highlights trade-offs between accuracy and computational time for different configurations.
---
### Components/Axes
- **X-axis**: "Time-to-Answer (longest thinking in thousands)" with values ranging from **16 to 22**.
- **Y-axis**: "Accuracy" with values ranging from **0.83 to 0.88**.
- **Legend**:
- **Red circles**: `majority@k`
- **Blue squares**: `short-1@k` (Ours)
- **Cyan diamonds**: `short-3@k` (Ours)
- **Data Points**:
- **k=1**: Cyan diamond at (16, 0.83)
- **k=3**:
- Blue square at (16, 0.84)
- Red circle at (21, 0.85)
- Cyan diamond at (18, 0.87)
- **k=5**:
- Blue square at (17, 0.84)
- Red circle at (21, 0.86)
- Cyan diamond at (19, 0.87)
- **k=9**:
- Blue square at (16, 0.84)
- Red circle at (22, 0.87)
- Cyan diamond at (16, 0.83)
---
### Detailed Analysis
- **Trends**:
- **`majority@k` (red circles)**: Accuracy increases with higher `k` (e.g., 0.85 at k=3, 0.86 at k=5, 0.87 at k=9), but time-to-answer also rises (21k to 22k). This suggests a **positive correlation** between `k` and both accuracy and time.
- **`short-1@k` (blue squares)**: Accuracy remains relatively stable (0.84–0.84) across `k` values, but time-to-answer increases slightly (16k to 17k). This indicates **minimal trade-off** between accuracy and time.
- **`short-3@k` (cyan diamonds)**: Accuracy improves with higher `k` (0.83 at k=1, 0.87 at k=9), but time-to-answer remains low (16k–19k). This shows a **stronger accuracy-time trade-off** compared to `short-1@k`.
- **Notable Outliers**:
- The `majority@k` method at k=9 (22k, 0.87) achieves the highest accuracy but requires the longest time.
- The `short-3@k` method at k=9 (19k, 0.87) balances high accuracy with moderate time, outperforming `majority@k` in time efficiency.
---
### Key Observations
1. **Accuracy-Time Trade-off**:
- `majority@k` prioritizes accuracy at the cost of time.
- `short-1@k` and `short-3@k` optimize for speed, with `short-3@k` achieving near-`majority@k` accuracy at lower time.
2. **k Value Impact**:
- Higher `k` values generally improve accuracy for all methods but increase time-to-answer.
- `short-3@k` at k=9 achieves the best balance (0.87 accuracy, 19k time).
---
### Interpretation
The data demonstrates that **`short-3@k`** offers a compelling middle ground between accuracy and efficiency, outperforming `majority@k` in time-to-answer while maintaining comparable accuracy. This suggests that the `short-3@k` method could be preferable in scenarios where computational resources are constrained. Conversely, `majority@k` is optimal for applications requiring maximum accuracy, even with higher latency. The `short-1@k` method, while efficient, shows limited accuracy gains with increasing `k`, making it less impactful for high-stakes tasks. The plot underscores the importance of method selection based on specific use-case priorities (accuracy vs. speed).