## Scatter Plot: Accuracy vs. Time-to-Answer
### Overview
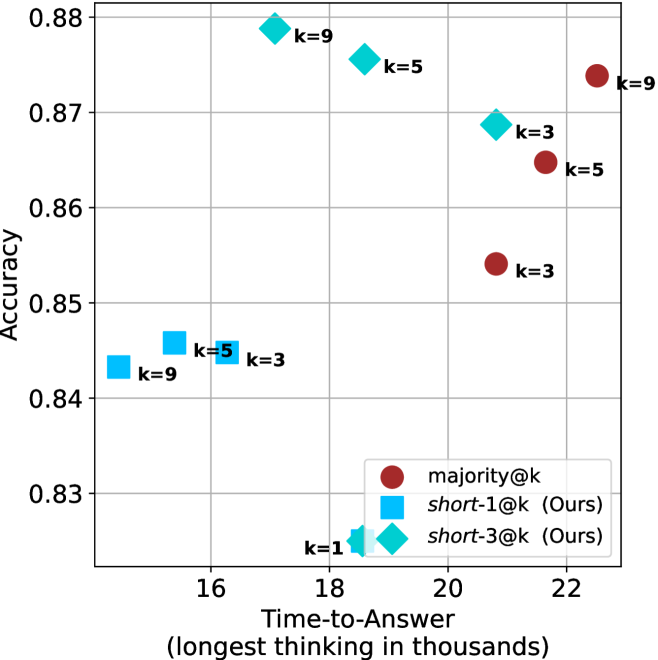
The image is a scatter plot comparing the accuracy of different methods (majority@k, short-1@k, and short-3@k) against their time-to-answer. The x-axis represents the time-to-answer in thousands, and the y-axis represents the accuracy. Each data point is labeled with a 'k' value, indicating a parameter associated with the method.
### Components/Axes
* **X-axis:** Time-to-Answer (longest thinking in thousands). Scale ranges from approximately 15 to 23.
* **Y-axis:** Accuracy. Scale ranges from 0.83 to 0.88.
* **Legend (bottom-right):**
* Red circle: majority@k
* Cyan square: short-1@k (Ours)
* Cyan diamond: short-3@k (Ours)
* **Data Points:** Each point is labeled with its corresponding 'k' value.
### Detailed Analysis
**1. majority@k (Red Circles):**
* Trend: As time-to-answer increases, accuracy generally increases.
* k=3: Time-to-Answer ≈ 21, Accuracy ≈ 0.853
* k=5: Time-to-Answer ≈ 21.5, Accuracy ≈ 0.864
* k=9: Time-to-Answer ≈ 22.2, Accuracy ≈ 0.874
**2. short-1@k (Cyan Squares):**
* Trend: As time-to-answer increases, accuracy increases slightly.
* k=9: Time-to-Answer ≈ 15.2, Accuracy ≈ 0.843
* k=5: Time-to-Answer ≈ 16.2, Accuracy ≈ 0.844
* k=3: Time-to-Answer ≈ 17, Accuracy ≈ 0.844
**3. short-3@k (Cyan Diamonds):**
* Trend: As time-to-answer increases, accuracy increases significantly.
* k=1: Time-to-Answer ≈ 17.8, Accuracy ≈ 0.826
* k=3: Time-to-Answer ≈ 19.8, Accuracy ≈ 0.869
* k=5: Time-to-Answer ≈ 19, Accuracy ≈ 0.875
* k=9: Time-to-Answer ≈ 18.5, Accuracy ≈ 0.878
### Key Observations
* The 'short-3@k' method (cyan diamonds) generally achieves the highest accuracy compared to the other methods.
* The 'short-1@k' method (cyan squares) has the lowest time-to-answer but also the lowest accuracy among the 'k' values shown.
* For the 'majority@k' method (red circles), increasing the 'k' value leads to higher accuracy and longer time-to-answer.
* For the 'short-3@k' method, increasing the 'k' value from 1 to 9 leads to higher accuracy and longer time-to-answer.
### Interpretation
The scatter plot illustrates the trade-off between accuracy and time-to-answer for different methods. The 'short-3@k' method appears to be the most effective, achieving high accuracy with a relatively short time-to-answer. The 'majority@k' method shows a clear positive correlation between 'k' value, accuracy, and time-to-answer. The 'short-1@k' method prioritizes speed but sacrifices accuracy. The choice of method would depend on the specific requirements of the application, balancing the need for accuracy with the constraint of time.