## Scatter Plot: Accuracy vs. Time-to-Answer for Different Methods
### Overview
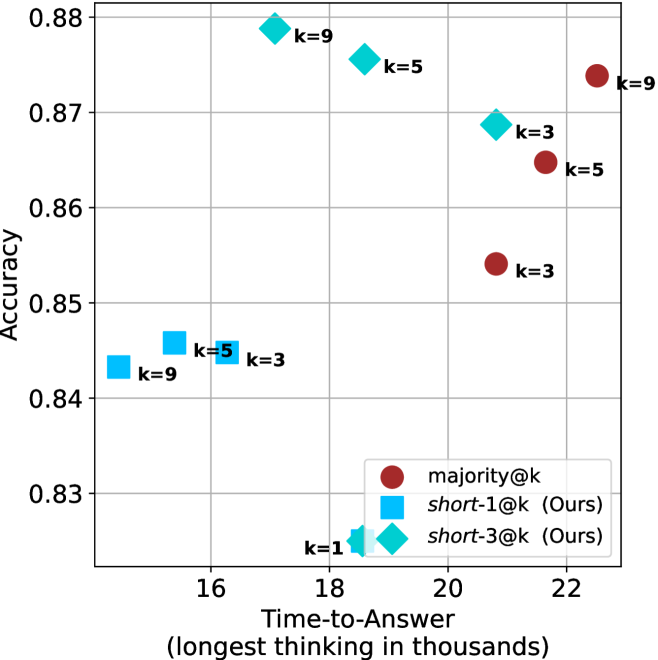
This scatter plot illustrates the performance trade-offs between three different methods—`majority@k`, `short-1@k` (Ours), and `short-3@k` (Ours)—across varying values of `k`. The chart maps "Accuracy" (Y-axis) against "Time-to-Answer" (X-axis), measured in thousands of units of "longest thinking." The data suggests a clear distinction in performance profiles between the three methods.
### Components/Axes
* **Y-Axis (Vertical):** Labeled "Accuracy." The scale ranges from 0.83 to 0.88, with grid lines at 0.01 intervals.
* **X-Axis (Horizontal):** Labeled "Time-to-Answer (longest thinking in thousands)." The scale ranges from 16 to 22, with grid lines at 2-unit intervals.
* **Legend (Bottom-Right):**
* **Dark Red Circle:** `majority@k`
* **Light Blue Square:** `short-1@k (Ours)`
* **Cyan Diamond:** `short-3@k (Ours)`
* **Data Labels:** Each data point is annotated with its corresponding `k` value (k=1, 3, 5, 9).
### Detailed Analysis
The data points are clustered by method. Below are the approximate coordinates (x, y) for each data point based on visual estimation:
#### 1. `majority@k` (Dark Red Circles)
*Trend: Positive correlation. As `k` increases, both Time-to-Answer and Accuracy increase.*
* **k=3:** (x ≈ 20.8, y ≈ 0.854)
* **k=5:** (x ≈ 21.7, y ≈ 0.865)
* **k=9:** (x ≈ 22.5, y ≈ 0.874)
#### 2. `short-3@k` (Cyan Diamonds)
*Trend: Negative correlation between `k` and Time-to-Answer. As `k` increases, Time-to-Answer decreases, while Accuracy remains relatively high.*
* **k=3:** (x ≈ 20.8, y ≈ 0.869)
* **k=5:** (x ≈ 18.5, y ≈ 0.876)
* **k=9:** (x ≈ 17.2, y ≈ 0.879)
#### 3. `short-1@k` (Light Blue Squares)
*Trend: Generally lower accuracy compared to the other two methods. Time-to-Answer is the lowest among all groups.*
* **k=3:** (x ≈ 16.2, y ≈ 0.845)
* **k=5:** (x ≈ 15.5, y ≈ 0.846)
* **k=9:** (x ≈ 14.8, y ≈ 0.843)
#### 4. Shared Data Point
* **k=1:** (x ≈ 18.5, y ≈ 0.825). This point appears to be a shared coordinate for both `short-1@k` and `short-3@k`, located at the bottom-center of the chart.
### Key Observations
* **Efficiency vs. Accuracy:** The `short-3@k` method appears to be the most efficient, achieving higher accuracy (0.879 at k=9) than `majority@k` (0.874 at k=9) while requiring significantly less time (17.2 vs 22.5).
* **Methodology Divergence:** The `majority@k` method follows a traditional trade-off where more computation (time) yields higher accuracy. In contrast, the `short-3@k` method demonstrates an inverse relationship where higher `k` values result in faster processing times while maintaining or improving accuracy.
* **Outliers:** The `k=1` data point is a significant outlier in terms of accuracy, performing notably worse (0.825) than all other configurations, regardless of the method.
### Interpretation
The data demonstrates that the "Ours" methods (`short-1@k` and `short-3@k`) are designed to optimize the trade-off between computational time and accuracy.
Specifically, `short-3@k` is the superior strategy in this dataset, as it occupies the "top-left" region of the chart—the ideal quadrant representing high accuracy with low time-to-answer. The fact that `short-3@k` improves in both speed and accuracy as `k` increases suggests that the underlying mechanism (likely a pruning or early-exit strategy) becomes more effective at higher `k` values. Conversely, `majority@k` represents a baseline that scales linearly in cost, making it less efficient than the proposed "short" methods.