\n
## Diagram: State Transition Diagram for RTBS
### Overview
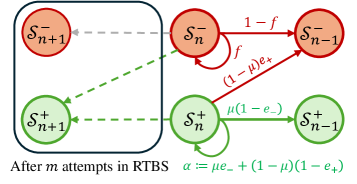
The image depicts a state transition diagram, likely representing a model within a Reinforcement Learning framework, specifically related to a process called RTBS (Reinforcement Training by Simulated annealing). The diagram illustrates transitions between four states: S<sub>n+1</sub><sup>-</sup>, S<sub>n</sub><sup>-</sup>, S<sub>n-1</sub><sup>-</sup>, S<sub>n+1</sub><sup>+</sup>, S<sub>n</sub><sup>+</sup>, and S<sub>n-1</sub><sup>+</sup>. The states are represented as colored circles, and the transitions between them are indicated by arrows labeled with probabilities or transition rates. A rectangular box encompasses the states S<sub>n+1</sub><sup>-</sup> and S<sub>n+1</sub><sup>+</sup>.
### Components/Axes
The diagram consists of the following components:
* **States:** S<sub>n+1</sub><sup>-</sup> (top-left, red), S<sub>n</sub><sup>-</sup> (top-center, red), S<sub>n-1</sub><sup>-</sup> (top-right, red), S<sub>n+1</sub><sup>+</sup> (bottom-left, green), S<sub>n</sub><sup>+</sup> (bottom-center, green), S<sub>n-1</sub><sup>+</sup> (bottom-right, green).
* **Transitions:** Arrows connecting the states, labeled with probabilities or rates.
* **Enclosing Box:** A gray dashed rectangle encompassing S<sub>n+1</sub><sup>-</sup> and S<sub>n+1</sub><sup>+</sup>.
* **Text Labels:** "After *m* attempts in RTBS" (bottom-left) and "α := μe<sub>-</sub> + (1 - μ)(1 - e<sub>+</sub>)" (bottom-right).
### Detailed Analysis or Content Details
The diagram shows the following transitions and their associated labels:
1. **S<sub>n</sub><sup>-</sup> to S<sub>n-1</sub><sup>-</sup>:** Labeled "1 - *f*".
2. **S<sub>n</sub><sup>-</sup> to S<sub>n+1</sub><sup>-</sup>:** Labeled "*f*".
3. **S<sub>n</sub><sup>-</sup> to S<sub>n+1</sub><sup>+</sup>:** Labeled "(1 - μ)e<sub>+</sub>".
4. **S<sub>n</sub><sup>+</sup> to S<sub>n-1</sub><sup>+</sup>:** Labeled "μ(1 - e<sub>-</sub>)".
5. **S<sub>n</sub><sup>+</sup> to S<sub>n+1</sub><sup>+</sup>:** A dashed gray arrow, no label.
6. **S<sub>n+1</sub><sup>-</sup> to S<sub>n</sub><sup>-</sup>:** A dashed gray arrow, no label.
7. **S<sub>n+1</sub><sup>+</sup> to S<sub>n</sub><sup>+</sup>:** A dashed gray arrow, no label.
The text label "After *m* attempts in RTBS" suggests that this diagram represents the state of the system after a certain number of iterations within the RTBS algorithm.
The equation "α := μe<sub>-</sub> + (1 - μ)(1 - e<sub>+</sub>)" defines a variable α in terms of μ, e<sub>-</sub>, and e<sub>+</sub>. The ":=" symbol indicates assignment.
### Key Observations
* The states are grouped into two sets: those with a negative superscript (-) and those with a positive superscript (+).
* The transitions between states are probabilistic, indicated by the labels on the arrows.
* The enclosing box around S<sub>n+1</sub><sup>-</sup> and S<sub>n+1</sub><sup>+</sup> might indicate a specific stage or condition within the RTBS process.
* The dashed arrows suggest a different type of transition or a less direct relationship between the states.
### Interpretation
This diagram likely represents a Markov chain or a similar stochastic process used to model the behavior of an agent learning through reinforcement learning with simulated annealing (RTBS). The states S<sub>n</sub><sup>+</sup> and S<sub>n</sub><sup>-</sup> could represent different "modes" or "phases" of the agent's behavior, with the superscript indicating a characteristic (e.g., positive or negative reward expectation).
The parameters *f*, μ, e<sub>+</sub>, and e<sub>-</sub> likely represent probabilities or rates governing the transitions between these states. *f* could represent the probability of staying in the negative state, while μ might represent the probability of transitioning to the positive state. e<sub>+</sub> and e<sub>-</sub> could be error terms or exploration rates.
The equation for α suggests that it is a weighted average of two terms, one related to the negative state (μe<sub>-</sub>) and the other to the positive state ((1 - μ)(1 - e<sub>+</sub>)). This could represent a measure of the agent's overall performance or a parameter controlling its learning rate.
The diagram suggests a cyclical process where the agent transitions between positive and negative states, with the probabilities of these transitions influenced by the parameters *f*, μ, e<sub>+</sub>, and e<sub>-</sub>. The RTBS algorithm likely adjusts these parameters over time to optimize the agent's behavior. The dashed lines indicate a possible feedback loop or a less direct influence between states. The box around the n+1 states could indicate a step in the algorithm.