## Neural Network Diagram: Forward and Backward Propagation
### Overview
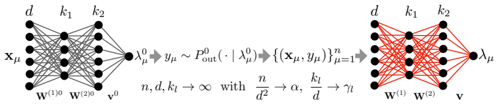
The image depicts a neural network diagram illustrating forward and backward propagation. The diagram is split into two sections, showing the network's state before and after training. The left side represents the initial state with gray connections, while the right side represents the trained state with red connections.
### Components/Axes
* **Nodes:** The diagram features nodes arranged in layers. The number of nodes in each layer varies.
* **Connections:** Lines connecting the nodes represent the weights between neurons. The color of the lines changes from gray (initial state) to red (trained state).
* **Labels:**
* Input Layer: x<sub>μ</sub>
* Hidden Layers: d, k<sub>1</sub>, k<sub>2</sub>
* Output Layer: λ<sub>μ</sub><sup>0</sup> (left), λ<sub>μ</sub> (right)
* Weights: w<sup>(1)0</sup>, w<sup>(2)0</sup> (left), w<sup>(1)</sup>, w<sup>(2)</sup> (right), v<sup>0</sup> (left), v (right)
* **Equations:**
* Left side: λ<sub>μ</sub><sup>0</sup> → y<sub>μ</sub> ~ P<sub>out</sub>(· | λ<sub>μ</sub><sup>0</sup>)
* Center: {(x<sub>μ</sub>, y<sub>μ</sub>)}<sub>μ=1</sub><sup>n</sup>
* Right side: n, d, k<sub>l</sub> → ∞ with n/d<sup>2</sup> → α, k<sub>l</sub>/d → γ<sub>l</sub>
### Detailed Analysis
**Left Side (Initial State):**
* The input layer is labeled x<sub>μ</sub> and has approximately 5 nodes.
* The first hidden layer is labeled 'd' and also has approximately 5 nodes.
* The second hidden layer is labeled 'k<sub>1</sub>' and has approximately 4 nodes.
* The third hidden layer is labeled 'k<sub>2</sub>' and has approximately 5 nodes.
* The output layer is labeled λ<sub>μ</sub><sup>0</sup> and has a single node.
* The connections between the layers are gray, indicating the initial, untrained state of the network.
* The weights associated with the connections are labeled w<sup>(1)0</sup>, w<sup>(2)0</sup>, and v<sup>0</sup>.
**Right Side (Trained State):**
* The input layer is labeled 'd' and has approximately 5 nodes.
* The first hidden layer is labeled 'k<sub>1</sub>' and has approximately 4 nodes.
* The second hidden layer is labeled 'k<sub>2</sub>' and has approximately 5 nodes.
* The output layer is labeled λ<sub>μ</sub> and has a single node.
* The connections between the layers are red, indicating the trained state of the network.
* The weights associated with the connections are labeled w<sup>(1)</sup>, w<sup>(2)</sup>, and v.
**Equations and Relationships:**
* The equation λ<sub>μ</sub><sup>0</sup> → y<sub>μ</sub> ~ P<sub>out</sub>(· | λ<sub>μ</sub><sup>0</sup>) describes the forward pass, where λ<sub>μ</sub><sup>0</sup> is the initial output, y<sub>μ</sub> is the target output, and P<sub>out</sub> is the output distribution.
* The term {(x<sub>μ</sub>, y<sub>μ</sub>)}<sub>μ=1</sub><sup>n</sup> represents the training dataset consisting of input-output pairs.
* The equation n, d, k<sub>l</sub> → ∞ with n/d<sup>2</sup> → α, k<sub>l</sub>/d → γ<sub>l</sub> describes the asymptotic behavior of the network as the number of training samples (n), input dimension (d), and hidden layer sizes (k<sub>l</sub>) approach infinity. α and γ<sub>l</sub> are constants.
### Key Observations
* The color change from gray to red signifies the transition from an untrained to a trained network.
* The diagram illustrates the flow of information from the input layer to the output layer during both forward and backward propagation.
* The equations provide a mathematical description of the network's behavior and training process.
### Interpretation
The diagram illustrates the fundamental concept of training a neural network. The left side represents the initial, random state of the network, where the connections (weights) are untrained. The right side represents the trained network, where the connections have been adjusted to map the input data to the desired output. The equations describe the mathematical relationships between the input, output, and network parameters. The asymptotic behavior equation suggests that the network's performance improves as the size of the network and the amount of training data increase. The diagram effectively visualizes the transformation of a neural network from a random mapping to a learned mapping through the process of training.