## Chart Type: Multiple Charts - Bar Chart and Line Charts
### Overview
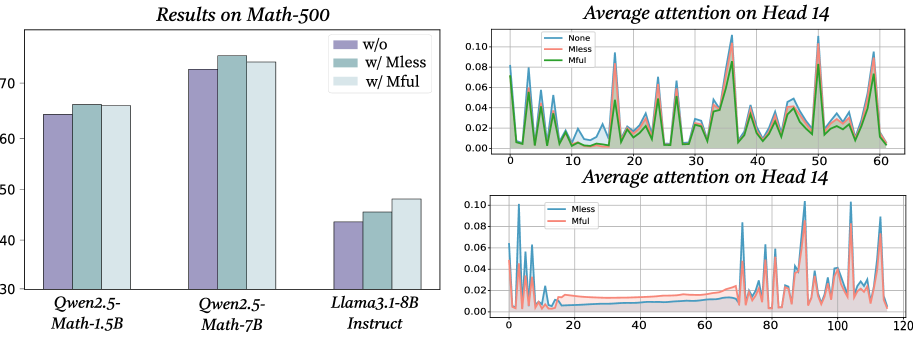
The image presents a combination of a bar chart and two line charts. The bar chart, titled "Results on Math-500," compares the performance of different models (Qwen2.5-Math-1.5B, Qwen2.5-Math-7B, and Llama3.1-8B Instruct) under three conditions: "w/o" (without), "w/ Mless" (with Mless), and "w/ Mful" (with Mful). The two line charts, both titled "Average attention on Head 14," display attention scores over a sequence or range, comparing "None," "Mless," and "Mful" in the top chart, and "Mless" and "Mful" in the bottom chart.
### Components/Axes
**Bar Chart:**
* **Title:** Results on Math-500
* **X-axis:** Categorical labels: Qwen2.5-Math-1.5B, Qwen2.5-Math-7B, Llama3.1-8B Instruct
* **Y-axis:** Numerical scale, ranging from 30 to 70.
* **Legend:** Located at the top-right of the bar chart.
* Purple: w/o
* Teal: w/ Mless
* Light Blue: w/ Mful
**Line Charts:**
* **Title:** Average attention on Head 14 (for both charts)
* **X-axis (Top):** Numerical sequence, ranging from 0 to 60.
* **Y-axis (Top):** Numerical scale, ranging from 0.00 to 0.10.
* **Legend (Top):** Located at the top-left of the top line chart.
* Blue: None
* Orange: Mless
* Green: Mful
* **X-axis (Bottom):** Numerical sequence, ranging from 0 to 120.
* **Y-axis (Bottom):** Numerical scale, ranging from 0.00 to 0.10.
* **Legend (Bottom):** Located at the top-left of the bottom line chart.
* Blue: Mless
* Orange: Mful
### Detailed Analysis
**Bar Chart:**
* **Qwen2.5-Math-1.5B:**
* w/o (Purple): Approximately 64
* w/ Mless (Teal): Approximately 66
* w/ Mful (Light Blue): Approximately 66
* **Qwen2.5-Math-7B:**
* w/o (Purple): Approximately 72
* w/ Mless (Teal): Approximately 74
* w/ Mful (Light Blue): Approximately 74
* **Llama3.1-8B Instruct:**
* w/o (Purple): Approximately 44
* w/ Mless (Teal): Approximately 46
* w/ Mful (Light Blue): Approximately 48
**Line Chart (Top):**
* **None (Blue):** Fluctuates significantly between 0.00 and 0.08, with several sharp peaks.
* **Mless (Orange):** Generally stays below 0.04, with some peaks aligning with the "None" series.
* **Mful (Green):** Similar to "Mless," but with slightly higher values and more frequent peaks.
**Line Chart (Bottom):**
* **Mless (Blue):** Shows high initial peaks, then stabilizes around 0.02 after x=40, with some later spikes.
* **Mful (Orange):** Remains relatively low and stable, generally below 0.02, with a slight upward trend after x=40.
### Key Observations
* The bar chart shows that "w/ Mful" generally results in the highest scores, followed closely by "w/ Mless," and then "w/o."
* Qwen2.5-Math-7B consistently outperforms Qwen2.5-Math-1.5B and Llama3.1-8B Instruct.
* In the top line chart, the "None" series exhibits the most volatile behavior.
* In the bottom line chart, "Mless" shows a significant initial spike in attention, which "Mful" does not.
### Interpretation
The "Results on Math-500" bar chart suggests that incorporating "Mless" or "Mful" consistently improves performance across different models. The "Average attention on Head 14" line charts provide insights into the attention mechanisms of these models. The top chart, comparing "None," "Mless," and "Mful," indicates that the absence of these components ("None") leads to more erratic attention patterns. The bottom chart highlights a difference in initial attention allocation between "Mless" and "Mful," with "Mless" exhibiting a strong initial focus that diminishes over time, while "Mful" maintains a more consistent, lower level of attention. This could imply that "Mless" initially focuses on specific features, while "Mful" distributes attention more evenly.