\n
## Image Series: Image Quality vs. Processing Level
### Overview
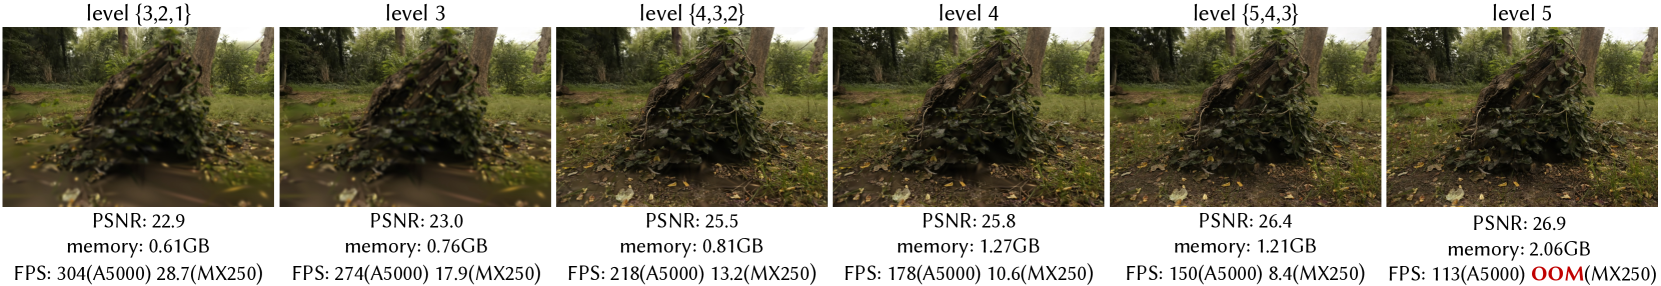
The image presents a series of six progressively processed images of a tree against a blurred background. Each image is labeled with a "level" indicating the processing stage, and accompanied by performance metrics: PSNR (Peak Signal-to-Noise Ratio), memory usage, and Frames Per Second (FPS) for different processing configurations (A5000 and MX250). The images demonstrate a trade-off between image quality (as indicated by PSNR) and computational resources (memory and FPS).
### Components/Axes
The image consists of six horizontally arranged panels. Each panel contains:
* **Image:** A visual representation of the processed image.
* **Level Label:** A text label indicating the processing level (e.g., "level (3,2,1)", "level 3", etc.).
* **Performance Metrics:** Three lines of text displaying PSNR, memory usage, and FPS.
The performance metrics are presented as follows:
* **PSNR:** A numerical value representing the image quality.
* **Memory:** The amount of memory used during processing, in GB.
* **FPS:** Frames Per Second, reported for both A5000 and MX250 GPUs.
### Detailed Analysis
Here's a breakdown of the data for each level:
* **Level (3,2,1):**
* PSNR: 22.9
* Memory: 0.61GB
* FPS (A5000): 304, (MX250): 28.7
* **Level 3:**
* PSNR: 23.0
* Memory: 0.76GB
* FPS (A5000): 274, (MX250): 17.9
* **Level (4,3,2):**
* PSNR: 25.5
* Memory: 0.81GB
* FPS (A5000): 218, (MX250): 13.2
* **Level 4:**
* PSNR: 25.8
* Memory: 1.27GB
* FPS (A5000): 178, (MX250): 10.6
* **Level (5,4,3):**
* PSNR: 26.4
* Memory: 1.21GB
* FPS (A5000): 150, (MX250): 8.4
* **Level 5:**
* PSNR: 26.9
* Memory: 2.06GB
* FPS (A5000): 113, (MX250): OOM (Out of Memory)
**Trends:**
* **PSNR:** The PSNR value generally increases with the processing level, indicating improved image quality. The increase is more pronounced between levels (3,2,1) and (4,3,2) and then plateaus.
* **Memory:** Memory usage consistently increases with the processing level.
* **FPS (A5000):** FPS decreases as the processing level increases, indicating a higher computational cost.
* **FPS (MX250):** FPS also decreases with the processing level. At level 5, the MX250 runs out of memory (OOM).
### Key Observations
* The MX250 GPU is unable to handle the processing at level 5 due to memory limitations.
* The A5000 GPU experiences a significant drop in FPS as the processing level increases, but remains functional at all levels.
* The largest jump in PSNR occurs between levels (3,2,1) and (4,3,2).
* There is a diminishing return in PSNR improvement for higher processing levels (4 and 5).
### Interpretation
The data suggests a trade-off between image quality, computational resources, and processing speed. Higher processing levels result in better image quality (higher PSNR) but require more memory and lead to lower FPS. The MX250 GPU demonstrates limited capacity for resource-intensive processing, while the A5000 GPU offers greater flexibility but still experiences performance degradation at higher levels.
The levels likely represent different stages of a processing pipeline, potentially involving more complex algorithms or higher resolution outputs. The diminishing returns in PSNR improvement at higher levels suggest that further processing may not significantly enhance the visual quality and could be inefficient. The "OOM" error on the MX250 at level 5 highlights the importance of considering hardware limitations when selecting processing parameters.
The image demonstrates a typical optimization problem: finding the optimal balance between quality and performance based on available resources. The choice of processing level would depend on the specific application requirements and the capabilities of the hardware.