## Pie Charts: Distribution of Categories Across Datasets
### Overview
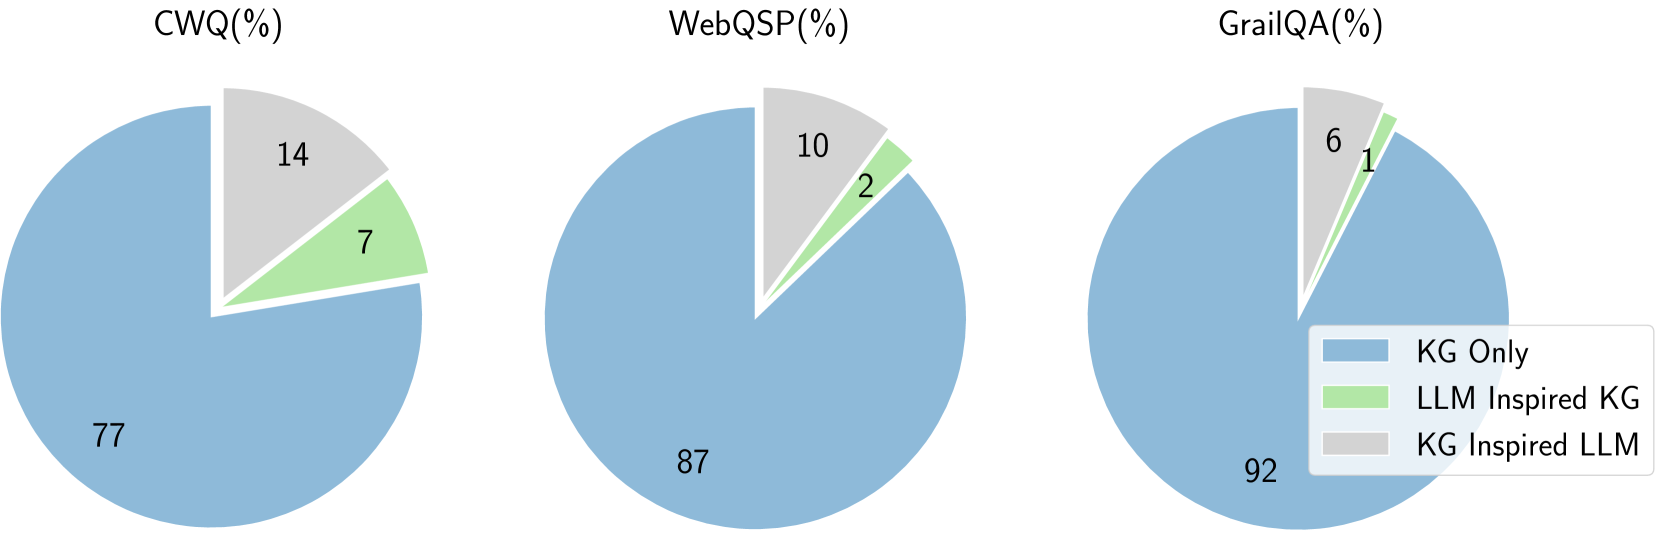
The image displays three pie charts, each representing a different dataset: CWQ, WebQSP, and GrailQA. Each pie chart is segmented into three categories, indicated by different colors and labeled with percentages. A legend is provided to identify the categories. The percentages within each slice represent the proportion of that category within the respective dataset.
### Components/Axes
* **Titles:**
* CWQ(%)
* WebQSP(%)
* GrailQA(%)
* **Legend:** Located in the bottom-right quadrant of the image.
* Blue swatch: KG Only
* Light green swatch: LLM Inspired KG
* Light grey swatch: KG Inspired LLM
### Detailed Analysis
**1. CWQ (%)**
* **Title:** CWQ(%)
* **Legend Mapping:**
* Blue slice (77%): KG Only
* Light green slice (7%): LLM Inspired KG
* Light grey slice (14%): KG Inspired LLM
* **Data Points:**
* KG Only: 77% (approximately)
* LLM Inspired KG: 7% (approximately)
* KG Inspired LLM: 14% (approximately)
* **Visual Trend:** The blue slice ("KG Only") is the largest, occupying the majority of the pie. The light grey slice ("KG Inspired LLM") is the second largest, and the light green slice ("LLM Inspired KG") is the smallest.
**2. WebQSP (%)**
* **Title:** WebQSP(%)
* **Legend Mapping:**
* Blue slice (87%): KG Only
* Light green slice (2%): LLM Inspired KG
* Light grey slice (10%): KG Inspired LLM
* **Data Points:**
* KG Only: 87% (approximately)
* LLM Inspired KG: 2% (approximately)
* KG Inspired LLM: 10% (approximately)
* **Visual Trend:** The blue slice ("KG Only") is overwhelmingly the largest. The light grey slice ("KG Inspired LLM") is the second largest, and the light green slice ("LLM Inspired KG") is the smallest.
**3. GrailQA (%)**
* **Title:** GrailQA(%)
* **Legend Mapping:**
* Blue slice (92%): KG Only
* Light green slice (1%): LLM Inspired KG
* Light grey slice (6%): KG Inspired LLM
* **Data Points:**
* KG Only: 92% (approximately)
* LLM Inspired KG: 1% (approximately)
* KG Inspired LLM: 6% (approximately)
* **Visual Trend:** The blue slice ("KG Only") is the dominant segment. The light grey slice ("KG Inspired LLM") is the second largest, and the light green slice ("LLM Inspired KG") is the smallest.
### Key Observations
* Across all three datasets (CWQ, WebQSP, and GrailQA), the "KG Only" category consistently represents the largest proportion, with percentages ranging from 77% to 92%.
* The "LLM Inspired KG" category consistently represents the smallest proportion in all three datasets, with percentages ranging from 1% to 7%.
* The "KG Inspired LLM" category consistently falls between "KG Only" and "LLM Inspired KG" in terms of proportion, ranging from 6% to 14%.
* The GrailQA dataset shows the highest dominance of "KG Only" (92%) and the lowest proportion for "LLM Inspired KG" (1%).
* The CWQ dataset has the most balanced distribution among the three categories compared to the other two datasets, although "KG Only" still dominates.
### Interpretation
The data presented in these pie charts suggests a strong reliance on "KG Only" (Knowledge Graph Only) approaches for the tasks represented by CWQ, WebQSP, and GrailQA. This indicates that traditional Knowledge Graph-based methods are the most prevalent or effective for these specific datasets.
The significantly smaller proportions of "LLM Inspired KG" and "KG Inspired LLM" suggest that hybrid approaches, or those that solely leverage LLMs for KG-related tasks, are less common or less successful in these contexts. The very low percentage for "LLM Inspired KG" in GrailQA (1%) is particularly noteworthy, implying that directly inspiring a KG with LLM outputs might not be a common or effective strategy for that particular dataset. Conversely, "KG Inspired LLM" shows a slightly higher presence, suggesting that using LLMs to enhance or guide KG construction or usage might be more explored than the other way around, though still a minority approach.
Overall, the charts demonstrate that for these specific question-answering or knowledge-related tasks, established Knowledge Graph methodologies remain the primary approach, with LLM-integrated or LLM-inspired methods playing a more supplementary or nascent role. The variation in proportions across the datasets might reflect differences in the complexity of the questions, the nature of the underlying knowledge, or the specific evaluation metrics used for each dataset.