\n
## Pie Charts: Distribution of Method Types Across Three QA Datasets
### Overview
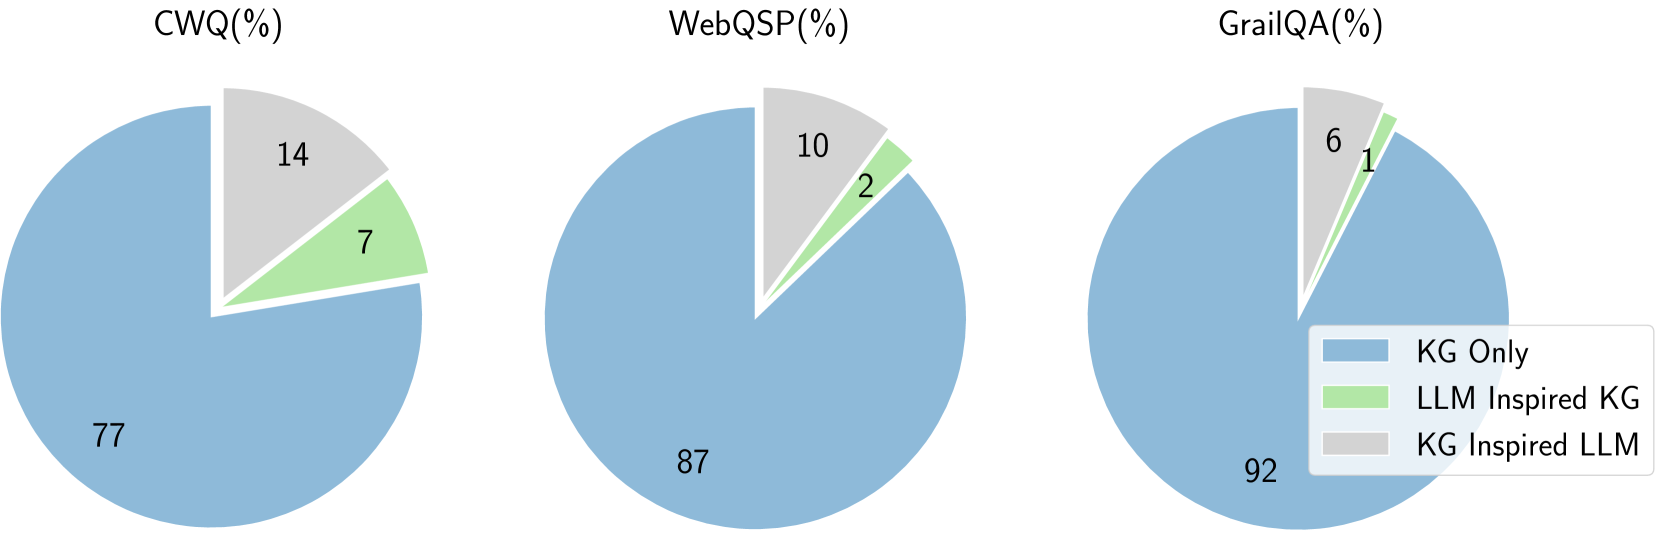
The image displays three pie charts arranged horizontally, each representing the percentage distribution of three method types for a specific question-answering (QA) dataset. The charts are titled "CWQ(%)", "WebQSP(%)", and "GrailQA(%)". A shared legend is positioned in the bottom-right corner of the image.
### Components/Axes
* **Chart Titles (Top-Center of each pie):**
* Left Chart: `CWQ(%)`
* Middle Chart: `WebQSP(%)`
* Right Chart: `GrailQA(%)`
* **Legend (Bottom-Right):**
* A blue square corresponds to the label: `KG Only`
* A light green square corresponds to the label: `LLM Inspired KG`
* A gray square corresponds to the label: `KG Inspired LLM`
* **Data Labels:** Each pie slice contains a numerical percentage value.
### Detailed Analysis
The data for each dataset is as follows:
**1. CWQ(%) Dataset (Left Chart):**
* **KG Only (Blue slice, dominant portion):** 77%
* **LLM Inspired KG (Green slice, small wedge):** 7%
* **KG Inspired LLM (Gray slice, medium wedge):** 14%
**2. WebQSP(%) Dataset (Middle Chart):**
* **KG Only (Blue slice, dominant portion):** 87%
* **LLM Inspired KG (Green slice, very small wedge):** 2%
* **KG Inspired LLM (Gray slice, small wedge):** 10%
**3. GrailQA(%) Dataset (Right Chart):**
* **KG Only (Blue slice, overwhelmingly dominant portion):** 92%
* **LLM Inspired KG (Green slice, minimal sliver):** 1%
* **KG Inspired LLM (Gray slice, very small wedge):** 6%
### Key Observations
1. **Dominance of "KG Only":** Across all three datasets, the "KG Only" method constitutes the vast majority of the distribution, ranging from 77% to 92%.
2. **Inverse Trend for "LLM Inspired KG":** The proportion of the "LLM Inspired KG" method decreases consistently across the datasets in the order presented: CWQ (7%) > WebQSP (2%) > GrailQA (1%).
3. **Inverse Trend for "KG Inspired LLM":** Similarly, the proportion of the "KG Inspired LLM" method also decreases across the datasets: CWQ (14%) > WebQSP (10%) > GrailQA (6%).
4. **Dataset Progression:** The visual trend suggests a progression where the reliance on pure Knowledge Graph (KG) methods increases from CWQ to WebQSP to GrailQA, while the hybrid or LLM-influenced methods decrease.
### Interpretation
The data suggests a strong and increasing reliance on pure Knowledge Graph (KG) approaches for the evaluated question-answering tasks across these three benchmark datasets. The "KG Only" method is not just dominant but becomes progressively more so, reaching 92% on the GrailQA dataset.
This pattern could indicate several underlying factors:
* **Dataset Nature:** The GrailQA dataset may be structured in a way that is particularly well-suited to formal KG querying, making hybrid or LLM-inspired approaches less necessary or effective. Conversely, CWQ might contain more questions that benefit from the flexibility of LLM-inspired methods.
* **Method Maturity:** The "KG Only" approaches might represent more established, reliable, or precisely controllable techniques for these specific QA tasks, leading to their preferential use.
* **Performance Trade-off:** The decreasing share of "LLM Inspired KG" and "KG Inspired LLM" methods might reflect a performance trade-off where, for these benchmarks, the added complexity of integrating LLMs does not yield sufficient accuracy gains over pure KG systems to justify their use in the majority of cases.
The charts effectively communicate that while hybrid KG-LLM methods exist, the evaluated systems or solutions for these datasets are overwhelmingly built upon core Knowledge Graph technology, with this trend strengthening across the CWQ -> WebQSP -> GrailQA progression.