## Diagram: Client Retention Prediction
### Overview
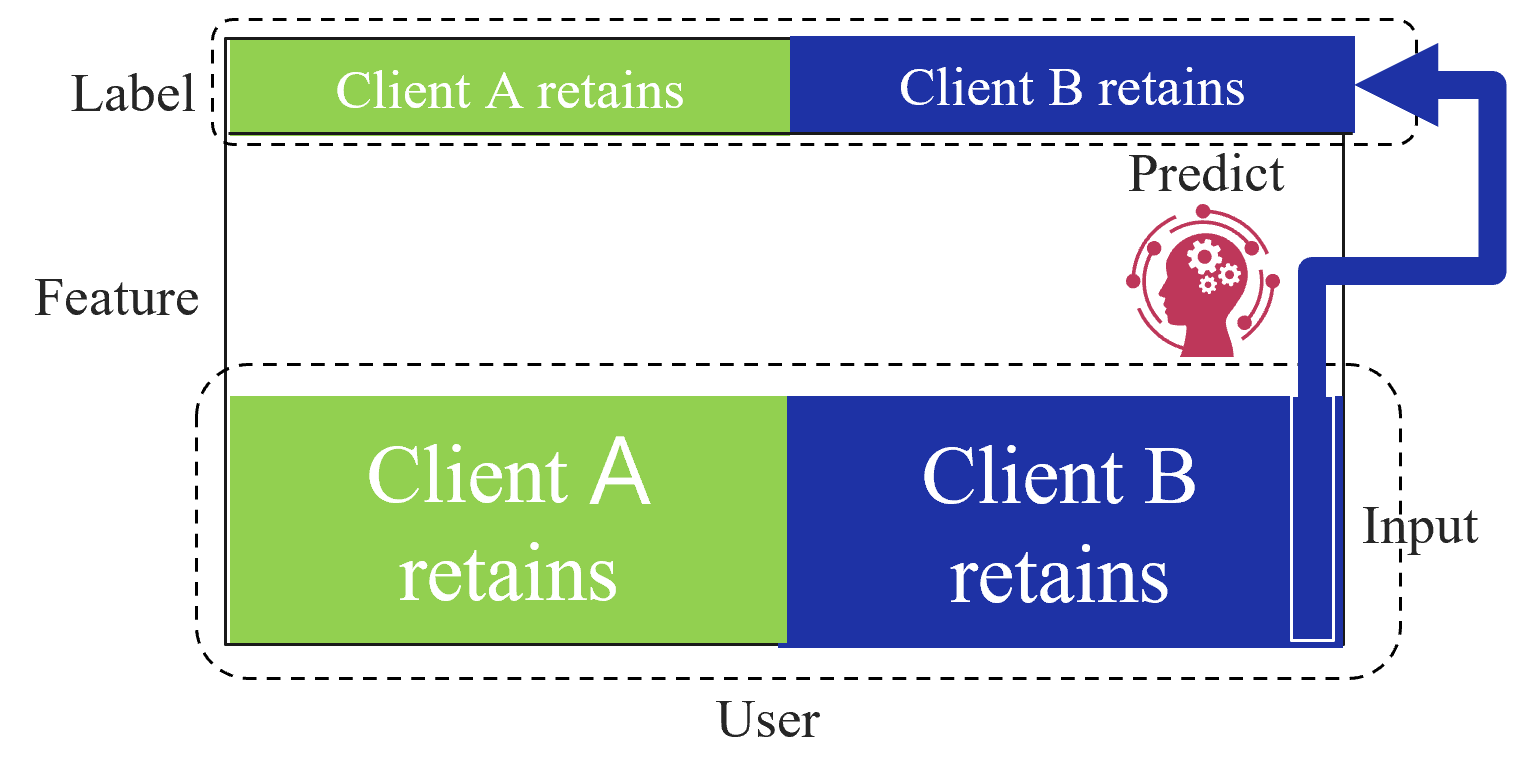
The image is a diagram illustrating a process for predicting client retention. It shows how user features are used as input to predict whether Client A or Client B will retain the user.
### Components/Axes
* **Vertical Axis (Left):**
* Label
* Feature
* **Horizontal Axis (Bottom):**
* User
* **Elements:**
* Two horizontal bars representing "Label" and "Feature" respectively.
* Each bar is divided into two sections: "Client A retains" (green) and "Client B retains" (blue).
* A "Predict" section with an icon of a head containing gears.
* An "Input" section.
* A blue arrow connecting the "Input" section to the "Predict" section, and then looping back to the "Label" section.
### Detailed Analysis or ### Content Details
* **Top Bar (Label):**
* Left Section (Green): "Client A retains"
* Right Section (Blue): "Client B retains"
* **Bottom Bar (Feature):**
* Left Section (Green): "Client A retains"
* Right Section (Blue): "Client B retains"
* **Predict:** Located to the right of the bars, above the "Input" section. Contains a red icon of a head silhouette with gears inside.
* **Input:** Located to the right of the bottom bar.
* **Arrow:** A thick blue arrow starts from the "Input" section, curves upwards and to the left, points to the "Predict" section, then curves further left and points to the "Client B retains" section of the "Label" bar.
### Key Observations
* The diagram suggests a cyclical process where user features are used to predict client retention, and the prediction is then used to refine the model.
* The green and blue sections in both bars represent the proportion or likelihood of a client retaining the user.
* The arrow indicates the flow of information from input features to prediction and then back to the label.
### Interpretation
The diagram illustrates a machine learning model for predicting client retention. User features are fed into the model ("Input"), which then predicts whether Client A or Client B will retain the user ("Predict"). This prediction is then compared to the actual outcome ("Label"), and the model is updated based on the difference between the prediction and the actual outcome. The cyclical nature of the diagram suggests a continuous learning process where the model is constantly being refined based on new data. The head with gears icon symbolizes the cognitive or computational process of prediction.