## Diagram: Client Data Retention and Prediction Flow
### Overview
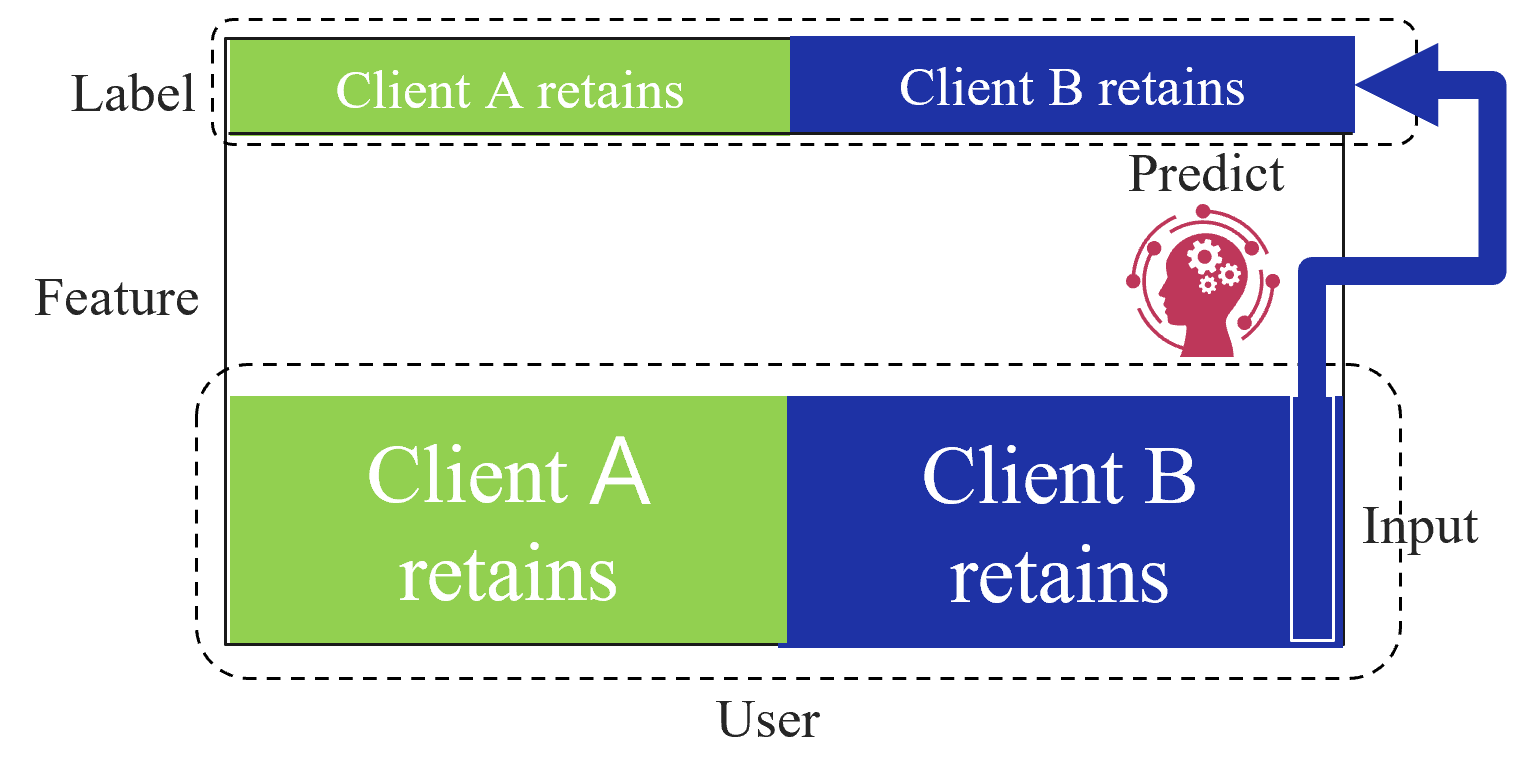
The diagram illustrates a two-client system (Client A and Client B) with distinct data retention zones for "Label" and "Feature" categories. A predictive process connects Client B's retained data to a feedback loop involving user input.
### Components/Axes
1. **Vertical Sections**:
- **Top Section**: Labeled "Label" with two color-coded zones:
- Green: "Client A retains"
- Blue: "Client B retains"
- **Bottom Section**: Labeled "Feature" with identical color coding:
- Green: "Client A retains"
- Blue: "Client B retains"
2. **Central Element**:
- A pink brain icon with gear motifs labeled "Predict"
3. **Flow Elements**:
- Blue arrow originating from "Client B retains" (Feature section)
- Connects to "Predict" icon
- Continues to "Input" section
- Final arrow loops back to "User" at the bottom
4. **Legend**:
- Green = Client A
- Blue = Client B
- Positioned at the top of the diagram
### Detailed Analysis
- **Client Data Retention**:
- Both clients maintain separate Label and Feature zones
- Client A's zones are consistently green
- Client B's zones are consistently blue
- No overlap between client zones in either section
- **Prediction Flow**:
- Client B's Feature data directly feeds into the prediction process
- Prediction output becomes input for the system
- Final arrow creates a closed loop back to the user
- **Color Consistency**:
- Green exclusively represents Client A in all instances
- Blue exclusively represents Client B in all instances
- No color mixing or ambiguity observed
### Key Observations
1. Client A's data remains isolated from Client B's data throughout the system
2. Client B's data is the sole input for the prediction process
3. The system creates a feedback loop between prediction output and user input
4. Color coding maintains strict client separation with no exceptions
### Interpretation
This diagram represents a client-specific machine learning architecture where:
1. **Data Isolation**: Client A and B maintain completely separate data repositories for both labels and features
2. **Client-Specific Processing**: Client B's data is prioritized for prediction tasks, suggesting it may contain more relevant or recent information
3. **User Feedback Loop**: The system incorporates user input to refine predictions, creating an iterative improvement cycle
4. **Architectural Design**: The strict color coding and physical separation of client zones emphasize data privacy and prevent cross-contamination between client datasets
The system appears designed for personalized prediction services where client data remains siloed but can be leveraged individually for model training and inference. The feedback loop suggests continuous model refinement based on user interactions.