## Line Chart: Accuracy vs. Sample Size
### Overview
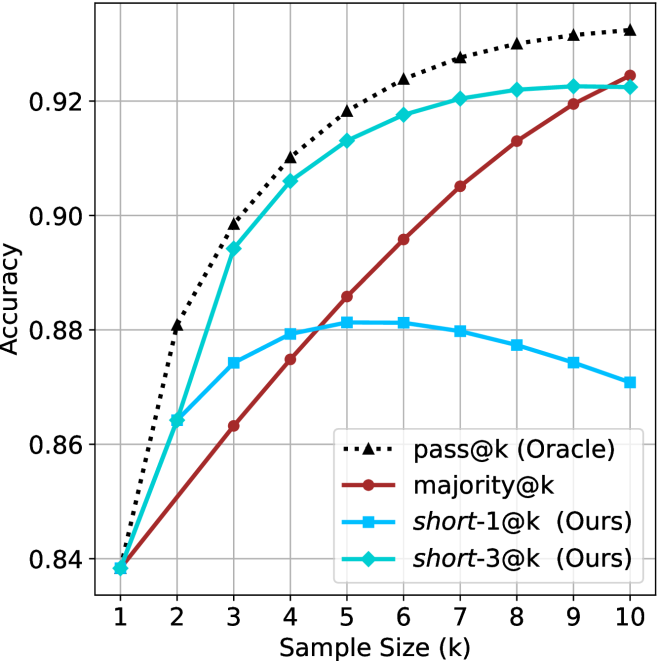
The image is a line chart comparing the accuracy of four different methods ("pass@k (Oracle)", "majority@k", "short-1@k (Ours)", and "short-3@k (Ours)") as a function of sample size (k), which ranges from 1 to 10. The y-axis represents accuracy, ranging from 0.84 to 0.92.
### Components/Axes
* **X-axis:** Sample Size (k), ranging from 1 to 10 in integer increments.
* **Y-axis:** Accuracy, ranging from 0.84 to 0.92 in increments of 0.02.
* **Legend:** Located in the bottom-right of the chart.
* `pass@k (Oracle)`: Black dotted line with triangle markers.
* `majority@k`: Brown line with circle markers.
* `short-1@k (Ours)`: Light blue line with square markers.
* `short-3@k (Ours)`: Cyan line with diamond markers.
### Detailed Analysis
* **pass@k (Oracle):** The black dotted line with triangle markers represents the "pass@k (Oracle)" method. The accuracy increases rapidly from k=1 to k=3, then plateaus.
* k=1: ~0.84
* k=2: ~0.88
* k=3: ~0.91
* k=6: ~0.92
* k=10: ~0.925
* **majority@k:** The brown line with circle markers represents the "majority@k" method. The accuracy increases linearly with the sample size.
* k=1: ~0.84
* k=3: ~0.86
* k=5: ~0.885
* k=7: ~0.905
* k=10: ~0.925
* **short-1@k (Ours):** The light blue line with square markers represents the "short-1@k (Ours)" method. The accuracy increases from k=1 to k=5, then decreases slightly.
* k=1: ~0.84
* k=3: ~0.875
* k=5: ~0.88
* k=7: ~0.877
* k=10: ~0.87
* **short-3@k (Ours):** The cyan line with diamond markers represents the "short-3@k (Ours)" method. The accuracy increases from k=1 to k=6, then plateaus.
* k=1: ~0.84
* k=3: ~0.895
* k=6: ~0.92
* k=10: ~0.923
### Key Observations
* The "pass@k (Oracle)" method achieves the highest accuracy overall, especially for smaller sample sizes.
* The "majority@k" method shows a steady, linear increase in accuracy as the sample size increases.
* The "short-1@k (Ours)" method initially increases in accuracy but then decreases slightly after k=5.
* The "short-3@k (Ours)" method performs well, approaching the accuracy of "pass@k (Oracle)" as the sample size increases.
### Interpretation
The chart compares the performance of different methods for a task, likely related to prediction or classification, as a function of the number of samples used. The "pass@k (Oracle)" method serves as an upper bound or ideal performance, while the other methods represent different approaches to the same problem. The "short-3@k (Ours)" method appears to be a competitive alternative, achieving similar accuracy to the "Oracle" method with larger sample sizes. The "short-1@k (Ours)" method's performance suggests that there may be a trade-off between sample size and accuracy for this particular approach. The linear increase of "majority@k" suggests a simpler, but less efficient, approach.