## Line Chart: Accuracy vs. Sample Size (k)
### Overview
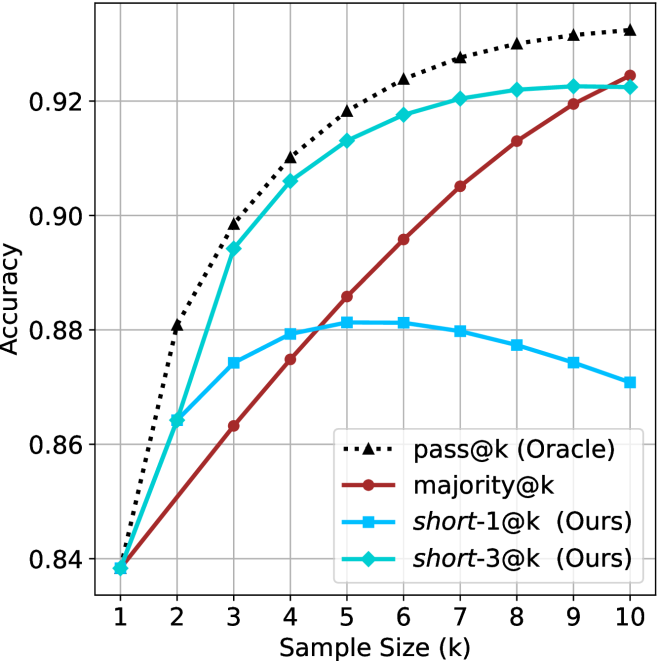
This image is a line chart illustrating the performance (Accuracy) of four different evaluation methods across varying sample sizes (k), ranging from 1 to 10. The chart compares a theoretical upper bound ("Oracle") against three practical methods: `majority@k`, `short-1@k`, and `short-3@k`.
### Components/Axes
* **X-axis:** Labeled "Sample Size (k)". The scale is linear, marked from 1 to 10 in increments of 1.
* **Y-axis:** Labeled "Accuracy". The scale ranges from 0.84 to 0.92+, with major grid lines at 0.02 intervals (0.84, 0.86, 0.88, 0.90, 0.92).
* **Legend:** Positioned in the bottom-right quadrant of the chart area.
* **`pass@k (Oracle)`**: Black dotted line with triangle markers.
* **`majority@k`**: Dark red solid line with circle markers.
* **`short-1@k (Ours)`**: Light blue solid line with square markers.
* **`short-3@k (Ours)`**: Cyan/Teal solid line with diamond markers.
### Detailed Analysis
The chart displays four distinct data series. All series originate from a common starting point at k=1, with an accuracy of approximately 0.838.
1. **`pass@k (Oracle)` (Black Dotted Line, Triangles):**
* **Trend:** Shows a steep, monotonic increase that begins to plateau as k increases. It consistently maintains the highest accuracy across all sample sizes.
* **Data Points:**
* k=1: ~0.838
* k=2: ~0.880
* k=5: ~0.918
* k=10: ~0.933
2. **`majority@k` (Dark Red Solid Line, Circles):**
* **Trend:** Shows a steady, nearly linear upward trajectory. It starts as the lowest performer but demonstrates the most consistent growth, eventually surpassing both "Ours" methods.
* **Data Points:**
* k=1: ~0.838
* k=5: ~0.885
* k=10: ~0.925
3. **`short-3@k (Ours)` (Cyan/Teal Solid Line, Diamonds):**
* **Trend:** Shows a rapid increase initially, similar to the Oracle, but begins to plateau significantly after k=6.
* **Data Points:**
* k=1: ~0.838
* k=2: ~0.865
* k=5: ~0.913
* k=10: ~0.923
4. **`short-1@k (Ours)` (Light Blue Solid Line, Squares):**
* **Trend:** Shows an initial increase, peaking at k=5, followed by a distinct downward trend (performance degradation) as k increases further.
* **Data Points:**
* k=1: ~0.838
* k=2: ~0.865
* k=5: ~0.881 (Peak)
* k=10: ~0.870
### Key Observations
* **Performance Crossover:** The `majority@k` method eventually outperforms both `short-1@k` and `short-3@k` as the sample size increases.
* **The "Short" Method Anomaly:** The `short-1@k` method exhibits a clear performance drop-off after k=5. This suggests that for this specific method, increasing the sample size beyond 5 introduces noise or overfitting that negatively impacts accuracy.
* **Oracle Gap:** The gap between the `pass@k (Oracle)` and the practical methods is widest at k=2 and narrows slightly for `majority@k` at k=10, though the Oracle remains superior throughout.
### Interpretation
This chart likely represents an evaluation of code generation models or similar probabilistic systems where "k" represents the number of samples generated.
* **`pass@k (Oracle)`** represents the theoretical ceiling—if the system generates *k* samples, what is the probability that at least one is correct?
* **`majority@k`** represents a voting mechanism. Its steady, linear growth suggests it is a robust method that benefits reliably from larger sample sizes.
* **`short-1@k` and `short-3@k`** appear to be heuristic-based filtering methods. The fact that `short-1@k` peaks and then declines is a critical finding; it implies that the filtering criteria used in this method become counter-productive when too many samples are provided, likely filtering out correct answers or favoring incorrect ones as the sample pool grows.
* **Strategic Takeaway:** If the goal is to maximize accuracy with a small sample size (k < 4), the "short" methods are superior. However, if the system allows for larger sample sizes (k > 6), `majority@k` is the more reliable and performant choice.