\n
## Pie Charts: Error Distribution Across Different Models
### Overview
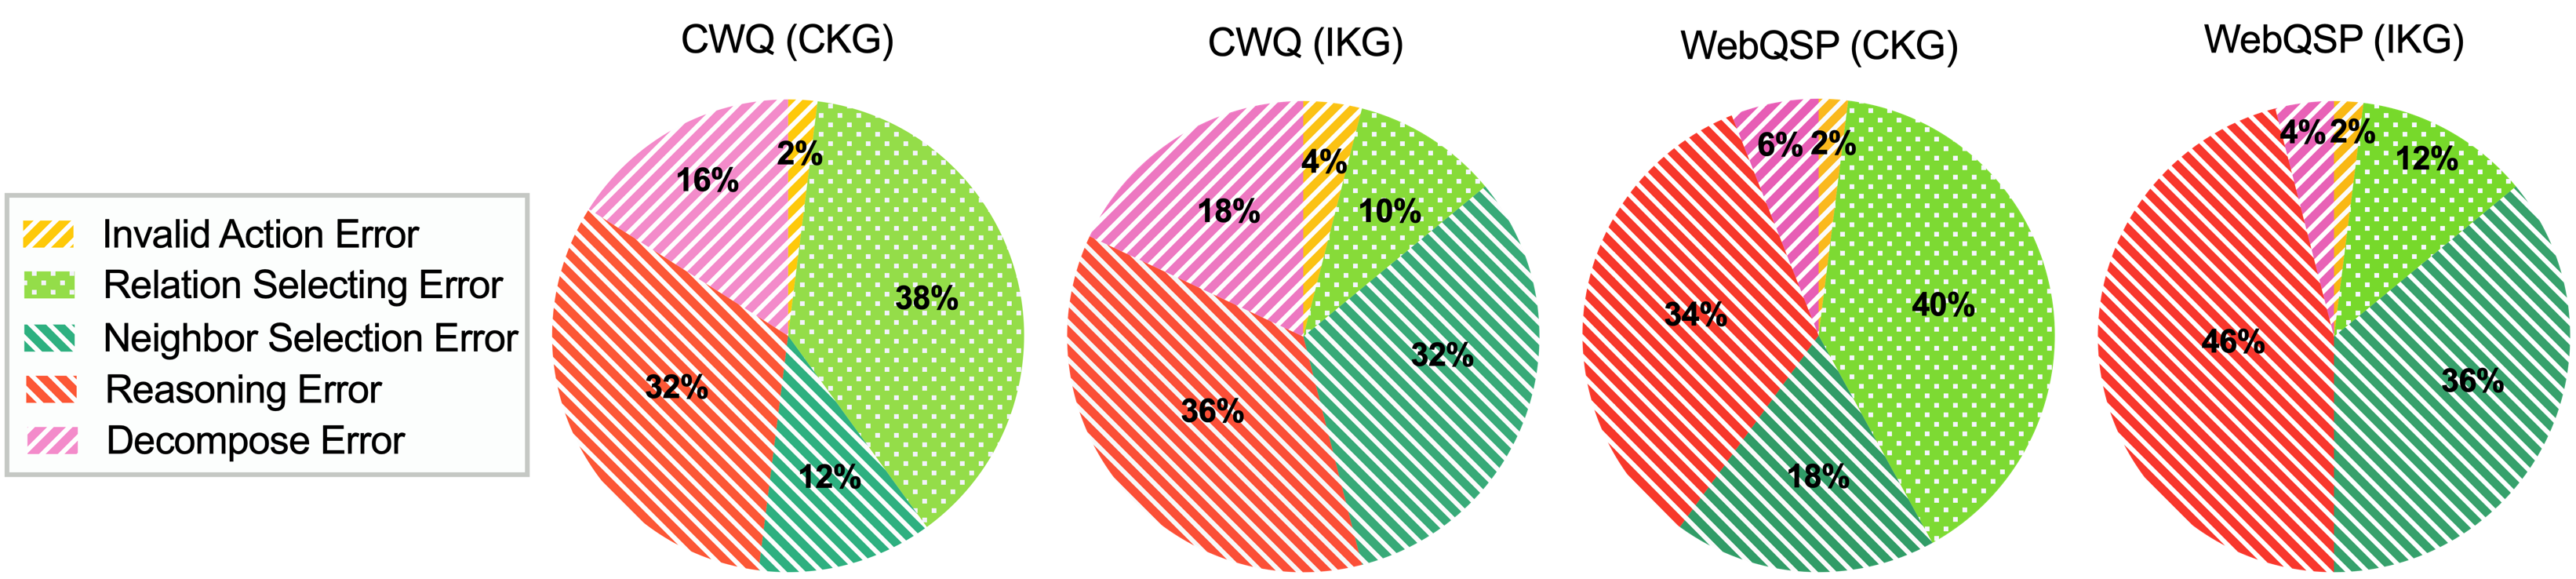
The image presents four pie charts, each representing the distribution of different error types across four different models: CWQ (CKG), CWQ (IKG), WebQSP (CKG), and WebQSP (IKG). The charts visually break down the percentage of each error type within each model.
### Components/Axes
Each chart has a legend in the bottom-left corner, defining the error types and their corresponding colors:
* **Invalid Action Error:** Red (Salmon)
* **Relation Selection Error:** Green (Light Green)
* **Neighbor Selection Error:** Teal (Medium Sea Green)
* **Reasoning Error:** Pink (Light Coral)
* **Decompose Error:** Purple (Lavender)
Each chart is labeled with the model name at the top. The charts themselves are circular, with each slice representing the percentage of a specific error type. The percentages are displayed directly on each slice.
### Detailed Analysis or Content Details
**1. CWQ (CKG)**
* **Invalid Action Error:** Approximately 2%
* **Relation Selection Error:** Approximately 38%
* **Neighbor Selection Error:** Approximately 32%
* **Reasoning Error:** Approximately 16%
* **Decompose Error:** Approximately 12%
**2. CWQ (IKG)**
* **Invalid Action Error:** Approximately 4%
* **Relation Selection Error:** Approximately 18%
* **Neighbor Selection Error:** Approximately 32%
* **Reasoning Error:** Approximately 36%
* **Decompose Error:** Approximately 10%
**3. WebQSP (CKG)**
* **Invalid Action Error:** Approximately 6%
* **Relation Selection Error:** Approximately 34%
* **Neighbor Selection Error:** Approximately 40%
* **Reasoning Error:** Approximately 18%
* **Decompose Error:** Approximately 2%
**4. WebQSP (IKG)**
* **Invalid Action Error:** Approximately 4%
* **Relation Selection Error:** Approximately 46%
* **Neighbor Selection Error:** Approximately 36%
* **Reasoning Error:** Approximately 12%
* **Decompose Error:** Approximately 2%
### Key Observations
* **Relation Selection Error** is the most frequent error type for all four models, ranging from 18% to 46%.
* **Decompose Error** consistently represents a small percentage of errors across all models (2-12%).
* **Neighbor Selection Error** is significant in CWQ (CKG) and WebQSP (CKG), but less so in the IKG versions.
* **Reasoning Error** is more prominent in CWQ (IKG) compared to the other models.
* **Invalid Action Error** is consistently the least frequent error type.
### Interpretation
The data suggests that all four models struggle most with relation selection, indicating a potential weakness in identifying the correct relationships between entities. The differences in error distributions between the CKG and IKG versions of each model suggest that the knowledge graph used (CKG vs. IKG) impacts the types of errors made. For example, the IKG version of CWQ has a higher proportion of Reasoning Errors, while the IKG version of WebQSP has a higher proportion of Relation Selection Errors. The consistently low percentage of Decompose Errors suggests that the decomposition process is relatively robust across all models. The variations in error profiles highlight the importance of considering the underlying knowledge graph and model architecture when analyzing performance and identifying areas for improvement. The models appear to have different strengths and weaknesses, and the choice of knowledge graph significantly influences the error distribution.