## Chart: DNN vs RMNN Performance
### Overview
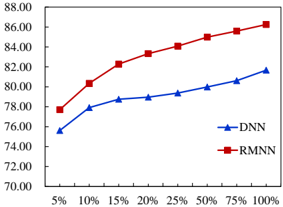
This image is a line chart comparing the performance of two models, DNN and RMNN, across different data percentages. The chart shows the accuracy of each model as the percentage of data used increases from 5% to 100%.
### Components/Axes
* **X-axis:** Data Percentage (5%, 10%, 15%, 20%, 25%, 50%, 75%, 100%)
* **Y-axis:** Accuracy (from 70.00 to 88.00)
* **Legend:**
* Blue line with triangle markers: DNN
* Red line with square markers: RMNN
### Detailed Analysis
* **DNN (Blue Line):**
* Trend: The DNN accuracy generally increases as the data percentage increases.
* Data Points:
* 5%: ~75.5
* 10%: ~78.0
* 15%: ~78.7
* 20%: ~79.0
* 25%: ~79.3
* 50%: ~79.9
* 75%: ~81.0
* 100%: ~81.8
* **RMNN (Red Line):**
* Trend: The RMNN accuracy also increases as the data percentage increases, and it consistently outperforms DNN.
* Data Points:
* 5%: ~77.7
* 10%: ~80.3
* 15%: ~82.3
* 20%: ~82.8
* 25%: ~83.8
* 50%: ~85.0
* 75%: ~85.6
* 100%: ~86.2
### Key Observations
* RMNN consistently outperforms DNN across all data percentages.
* Both models show increasing accuracy with more data.
* The rate of increase in accuracy appears to slow down as the data percentage approaches 100%.
### Interpretation
The chart demonstrates that the RMNN model is more accurate than the DNN model for the given task, regardless of the amount of data used. Both models benefit from increased data, but the RMNN model maintains a higher level of performance. The diminishing returns observed as the data percentage increases suggest that there may be a point beyond which adding more data yields only marginal improvements in accuracy. This information is valuable for model selection and resource allocation, indicating that RMNN is the preferred choice and that focusing on data acquisition beyond a certain point may not be cost-effective.