## Line Chart: Success Rate vs. Seen Examples During Training
### Overview
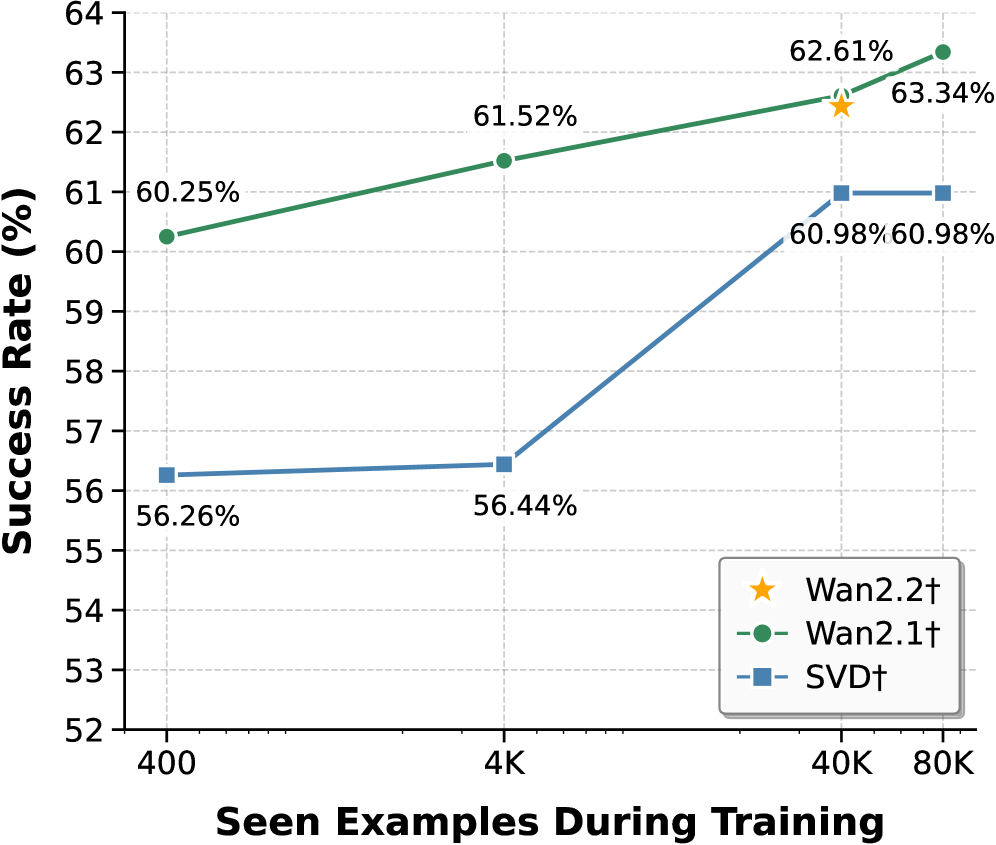
The chart compares the success rates of three models (Wan2.2†, Wan2.1†, SVD†) as a function of the number of training examples seen during training. Success rate is plotted on the y-axis (52%–64%), and training examples are on the x-axis (400–80K). Three data series are represented with distinct markers and colors: Wan2.2† (yellow star), Wan2.1† (green line), and SVD† (blue line).
### Components/Axes
- **X-axis (Seen Examples During Training)**: Labeled with values 400, 4K, 40K, and 80K.
- **Y-axis (Success Rate %)**: Labeled with increments from 52% to 64%.
- **Legend**: Located in the bottom-right corner, mapping:
- Yellow star → Wan2.2†
- Green line → Wan2.1†
- Blue line → SVD†
### Detailed Analysis
1. **Wan2.1† (Green Line)**:
- Starts at **60.25%** at 400 examples.
- Increases steadily to **61.52%** at 4K examples.
- Reaches **62.61%** at 40K examples.
- Peaks at **63.34%** at 80K examples.
- *Trend*: Consistent upward slope with no plateaus.
2. **SVD† (Blue Line)**:
- Begins at **56.26%** at 400 examples.
- Rises sharply to **56.44%** at 4K examples.
- Jumps to **60.98%** at 40K examples.
- Remains flat at **60.98%** at 80K examples.
- *Trend*: Steep initial increase followed by a plateau.
3. **Wan2.2† (Yellow Star)**:
- Single data point at **62.61%** at 40K examples.
- No data provided for other x-axis values.
- *Trend*: Isolated point; no trend inferred.
### Key Observations
- **Wan2.1†** demonstrates the highest success rate across all training example ranges, with a steady improvement as training data increases.
- **SVD†** shows a significant performance boost between 4K and 40K examples but plateaus afterward, suggesting diminishing returns.
- **Wan2.2†** outperforms SVD† at 40K examples but lacks data for other ranges, limiting direct comparison.
- Wan2.1† maintains a lead over SVD† even at 80K examples (63.34% vs. 60.98%).
### Interpretation
The data suggests that **Wan2.1†** is the most effective model for leveraging training examples, with a clear correlation between increased training data and improved success rates. **SVD†** performs well at mid-scale training (40K examples) but may not scale efficiently beyond that. **Wan2.2†** appears promising but requires additional data points to assess its full potential. The plateau in SVD†’s performance at 80K examples raises questions about its scalability, while Wan2.1†’s linear improvement indicates robust adaptability to larger datasets.