\n
## Horizontal Stacked Bar Chart: Documentation Depth by Category
### Overview
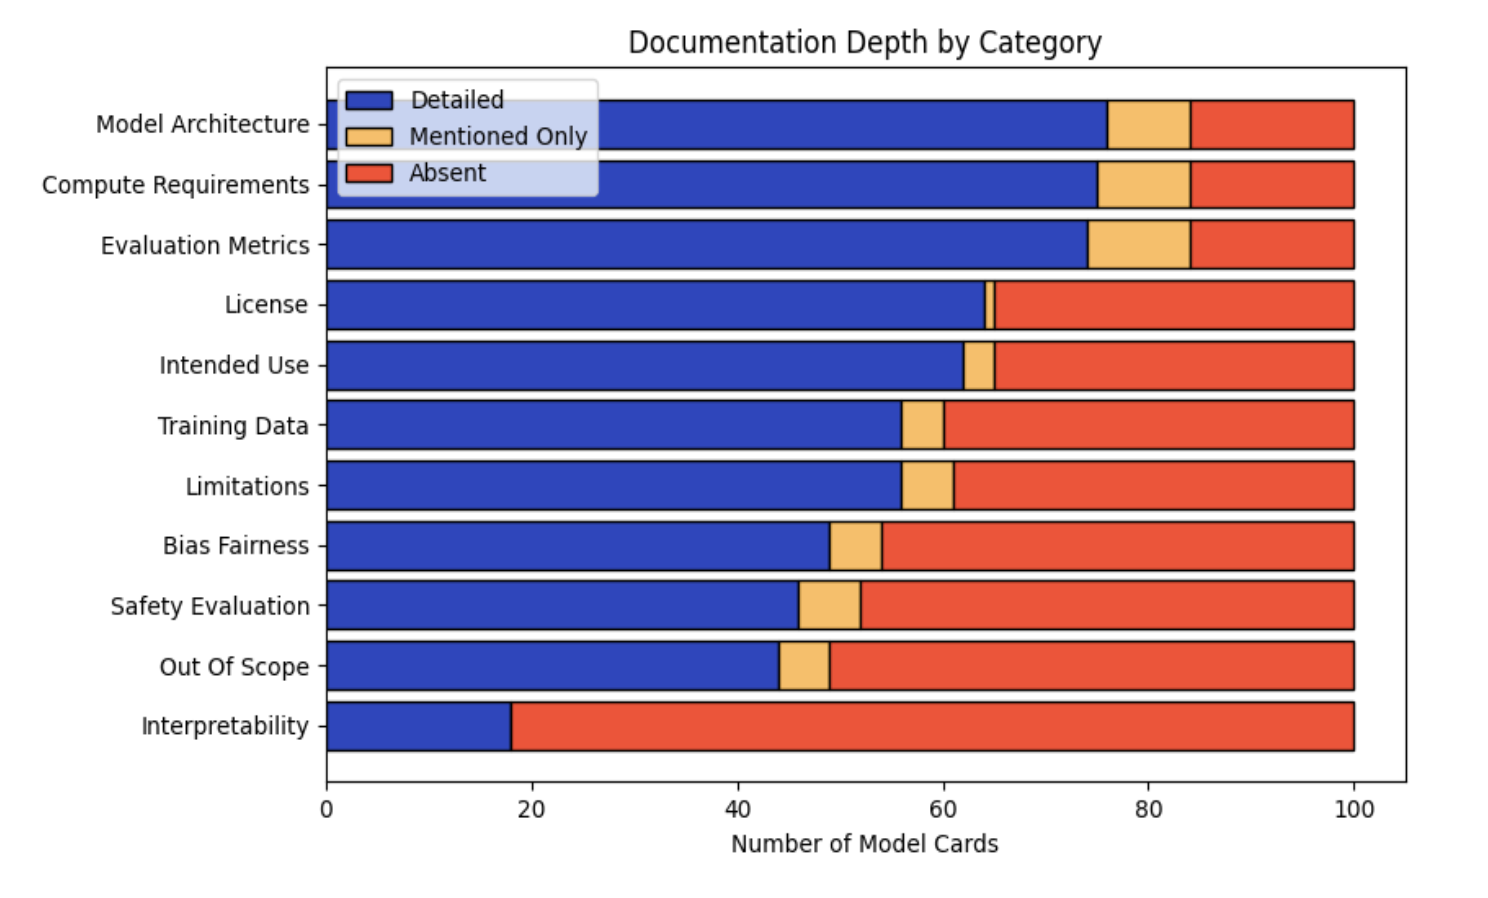
This image is a horizontal stacked bar chart titled "Documentation Depth by Category." It visualizes the level of documentation provided across 11 different categories within a set of "Model Cards." Each bar represents a category and is segmented into three colors indicating the depth of documentation: "Detailed" (blue), "Mentioned Only" (yellow), and "Absent" (red). The total length of each bar represents 100 model cards.
### Components/Axes
* **Title:** "Documentation Depth by Category" (centered at the top).
* **Legend:** Located in the top-left corner of the chart area. It defines the three data series:
* **Detailed:** Blue color.
* **Mentioned Only:** Yellow color.
* **Absent:** Red color.
* **Y-Axis (Vertical):** Lists the 11 documentation categories. From top to bottom:
1. Model Architecture
2. Compute Requirements
3. Evaluation Metrics
4. License
5. Intended Use
6. Training Data
7. Limitations
8. Bias Fairness
9. Safety Evaluation
10. Out Of Scope
11. Interpretability
* **X-Axis (Horizontal):** Labeled "Number of Model Cards." The scale runs from 0 to 100, with major tick marks at intervals of 20 (0, 20, 40, 60, 80, 100).
### Detailed Analysis
The following table reconstructs the approximate data for each category. Values are estimated based on the bar segment lengths relative to the x-axis scale. The sum for each row is 100.
| Category | Detailed (Blue) | Mentioned Only (Yellow) | Absent (Red) |
| :--- | :--- | :--- | :--- |
| **Model Architecture** | ~76 | ~8 | ~16 |
| **Compute Requirements** | ~75 | ~9 | ~16 |
| **Evaluation Metrics** | ~74 | ~10 | ~16 |
| **License** | ~64 | ~1 | ~35 |
| **Intended Use** | ~62 | ~3 | ~35 |
| **Training Data** | ~56 | ~4 | ~40 |
| **Limitations** | ~56 | ~5 | ~39 |
| **Bias Fairness** | ~49 | ~5 | ~46 |
| **Safety Evaluation** | ~46 | ~6 | ~48 |
| **Out Of Scope** | ~44 | ~5 | ~51 |
| **Interpretability** | ~18 | ~0 | ~82 |
**Trend Verification:**
* The "Detailed" (blue) segment shows a clear downward trend from the top category ("Model Architecture") to the bottom category ("Interpretability"). The line formed by the right edge of the blue segments slopes consistently downward.
* The "Absent" (red) segment shows a corresponding upward trend, increasing in length as you move down the list of categories.
* The "Mentioned Only" (yellow) segment is generally small across all categories, with no strong directional trend.
### Key Observations
1. **Best Documented Categories:** "Model Architecture," "Compute Requirements," and "Evaluation Metrics" have the highest proportion of detailed documentation, each with over 70% of model cards providing details.
2. **Worst Documented Category:** "Interpretability" is a significant outlier. It has the lowest "Detailed" score (~18) and the highest "Absent" score (~82), indicating it is rarely documented in detail and often completely missing.
3. **Binary Documentation Pattern:** For categories like "License" and "Intended Use," the "Mentioned Only" segment is very thin (~1-3). This suggests documentation tends to be either comprehensive ("Detailed") or entirely missing ("Absent"), with little middle ground.
4. **Ethical & Safety Gaps:** Categories related to ethical considerations and safety ("Bias Fairness," "Safety Evaluation," "Out Of Scope") all show less than 50% detailed documentation and have "Absent" portions approaching or exceeding 50%.
### Interpretation
This chart provides a quantitative audit of transparency in AI model documentation (specifically "Model Cards"). The data suggests a strong bias towards documenting technical specifications (architecture, compute, metrics) over ethical, safety, and usage considerations.
The stark gradient from top to bottom reveals a hierarchy of documentation priorities. Foundational technical details are consistently reported, while crucial context about a model's limitations, biases, safe application boundaries, and inner workings ("Interpretability") is frequently omitted. This creates a significant information asymmetry: users may know *what* the model is and *how* it was built, but have little insight into *how it behaves* in complex real-world scenarios or *how to use it responsibly*.
The near absence of the "Mentioned Only" category for many items indicates an "all-or-nothing" approach to documentation. This lack of partial disclosure means that if a topic isn't covered in depth, it is likely not addressed at all, leaving dangerous knowledge gaps. The extreme case of "Interpretability" highlights a critical blind spot in the field, where the mechanisms of model decision-making are largely opaque in public documentation.