## Line Chart: Peak Memory Usage vs. Batch Size
### Overview
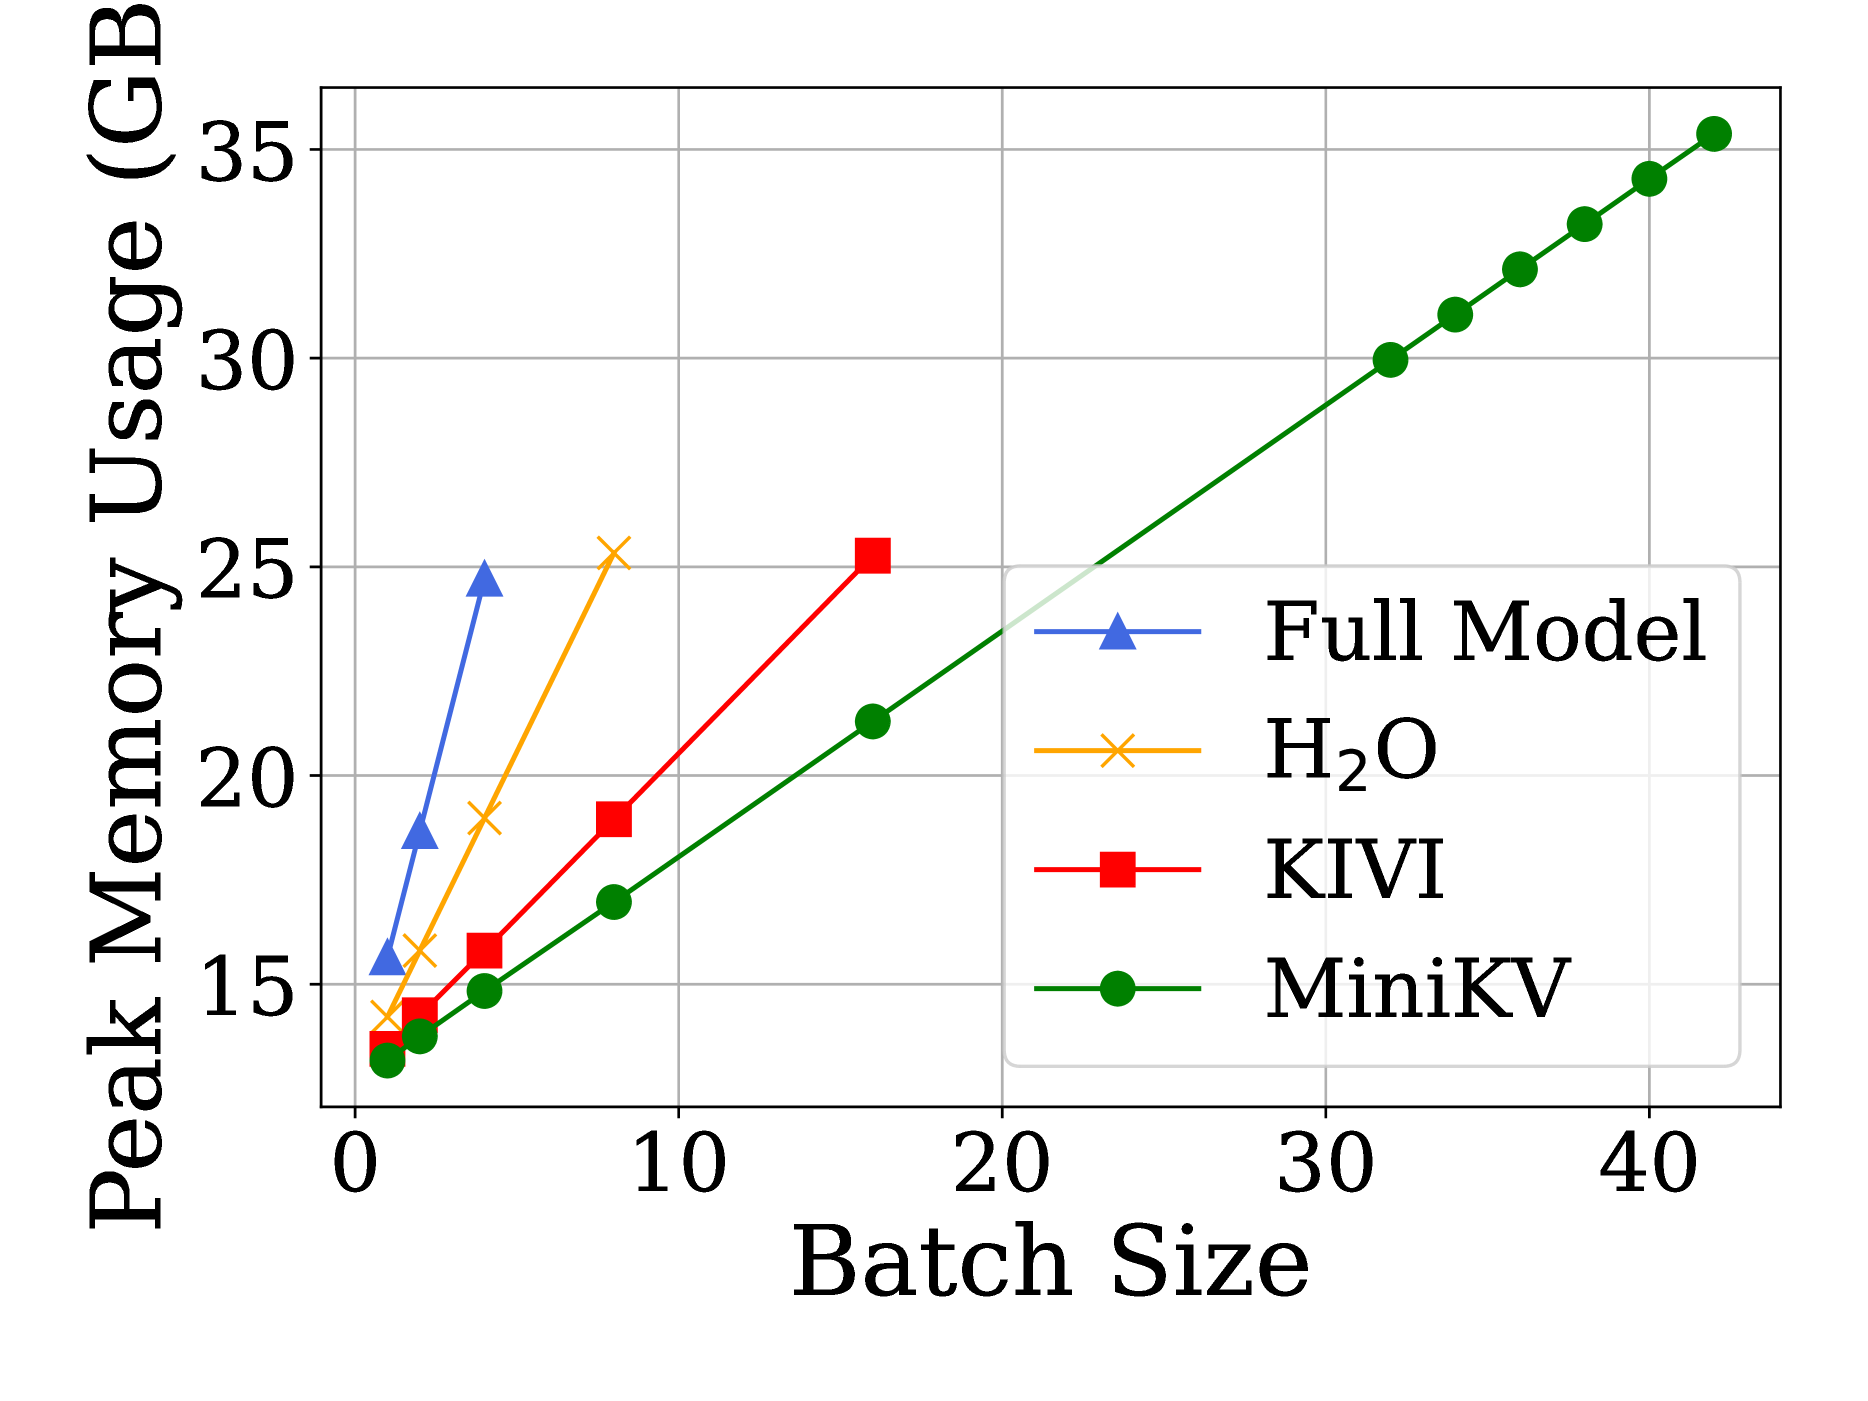
The chart illustrates the relationship between batch size (x-axis) and peak memory usage (y-axis, in GB) for four computational models: Full Model, H₂O, KIVI, and MiniKV. Data points are represented by distinct markers (triangles, crosses, squares, circles) and connected by lines. The y-axis ranges from 0 to 35 GB, while the x-axis spans batch sizes from 0 to 40.
### Components/Axes
- **X-axis (Batch Size)**: Labeled "Batch Size," with increments of 10 (0, 10, 20, 30, 40).
- **Y-axis (Peak Memory Usage)**: Labeled "Peak Memory Usage (GB)," with increments of 5 (0, 5, 10, 15, 20, 25, 30, 35).
- **Legend**: Located in the bottom-right corner, associating colors and markers with models:
- **Blue triangles**: Full Model
- **Orange crosses**: H₂O
- **Red squares**: KIVI
- **Green circles**: MiniKV
### Detailed Analysis
1. **Full Model (Blue Triangles)**:
- Starts at ~15 GB (batch size 0).
- Peaks at ~25 GB (batch size 5).
- Drops to ~15 GB (batch size 10).
- No further data points beyond batch size 10.
2. **H₂O (Orange Crosses)**:
- Starts at ~15 GB (batch size 0).
- Peaks at ~25 GB (batch size 8).
- Drops to ~15 GB (batch size 10).
- No further data points beyond batch size 10.
3. **KIVI (Red Squares)**:
- Starts at ~15 GB (batch size 0).
- Increases steadily to ~25 GB (batch size 15).
- No further data points beyond batch size 15.
4. **MiniKV (Green Circles)**:
- Starts at ~13 GB (batch size 0).
- Increases linearly to ~35 GB (batch size 40).
- Consistent upward trend across all batch sizes.
### Key Observations
- **MiniKV** exhibits the highest memory usage, scaling linearly with batch size.
- **Full Model** and **H₂O** show peak memory usage at mid-range batch sizes (5–8), followed by a sharp decline.
- **KIVI** demonstrates a steady increase in memory usage but plateaus at batch size 15.
- All models except MiniKV lack data beyond batch size 15–10, suggesting limited testing or optimization constraints.
### Interpretation
The data suggests that **MiniKV** is the most memory-intensive model, with memory usage growing proportionally to batch size. This could indicate inefficiencies in memory management or architectural design. In contrast, **Full Model** and **H₂O** appear optimized for smaller batch sizes, as their memory usage drops after peaking. **KIVI**’s linear trend implies predictable but resource-heavy scaling. The absence of data beyond certain batch sizes for most models may reflect practical limitations in testing or deployment scenarios. The chart highlights trade-offs between batch size scalability and memory efficiency across different computational frameworks.