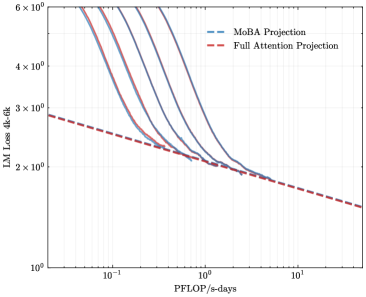
## Line Graph: LM Loss vs. PFlOP/s-days Projections
### Overview
The image is a logarithmic line graph comparing two computational efficiency projections: "MoBA Projection" (blue dashed lines) and "Full Attention Projection" (red dashed line). The y-axis represents "LM Loss 4k-6k" (language model loss) on a logarithmic scale (10⁰ to 6×10⁰), while the x-axis represents "PFlOP/s-days" (petaFLOPS per second-days) on a logarithmic scale (10⁻¹ to 10¹). The graph illustrates how loss decreases with increasing computational resources for both approaches.
### Components/Axes
- **X-axis (PFlOP/s-days)**: Logarithmic scale from 10⁻¹ to 10¹, with gridlines at 10⁻¹, 10⁰, and 10¹.
- **Y-axis (LM Loss 4k-6k)**: Logarithmic scale from 10⁰ to 6×10⁰, with gridlines at 10⁰, 2×10⁰, 3×10⁰, 4×10⁰, 5×10⁰, and 6×10⁰.
- **Legend**: Located in the top-right corner, associating:
- Blue dashed lines → "MoBA Projection"
- Red dashed line → "Full Attention Projection"
### Detailed Analysis
1. **MoBA Projection (Blue Dashed Lines)**:
- Multiple overlapping blue dashed lines originate near the top-left (high loss, low FLOP) and steeply decline as FLOP increases.
- At ~10⁻¹ PFlOP/s-days, loss values range between ~4×10⁰ to 6×10⁰.
- By ~10⁰ PFlOP/s-days, loss drops to ~2×10⁰.
- Beyond ~10¹ PFlOP/s-days, loss plateaus near ~1×10⁰.
- Uncertainty: Lines are closely packed, suggesting variability in MoBA's performance across scenarios.
2. **Full Attention Projection (Red Dashed Line)**:
- A single red dashed line starts at ~3×10⁰ loss at ~10⁻¹ PFlOP/s-days.
- Declines linearly (on log scale) to ~1×10⁰ loss at ~10¹ PFlOP/s-days.
- Maintains a consistent slope, indicating a predictable loss reduction rate.
### Key Observations
- **MoBA Projection** shows a steeper initial decline in loss compared to Full Attention, suggesting faster efficiency gains at lower FLOP scales.
- **Full Attention Projection** exhibits a linear relationship between FLOP and loss reduction, implying diminishing returns at higher computational scales.
- **Convergence**: Both projections intersect near ~10⁰ PFlOP/s-days (~2×10⁰ loss), after which MoBA's loss remains lower.
### Interpretation
The graph highlights a trade-off in computational efficiency:
- **MoBA** appears more efficient for tasks requiring rapid loss reduction at moderate FLOP scales, potentially due to architectural optimizations.
- **Full Attention**'s linear trend suggests it scales predictably but may require significantly more resources to achieve comparable loss reductions.
- The plateau in MoBA's loss at high FLOP implies diminishing marginal gains, while Full Attention's linear trend indicates no such saturation.
This analysis underscores the importance of balancing computational resources with model architecture for optimizing language model performance.