## Line Chart: HealthBench Model Performance Comparison
### Overview
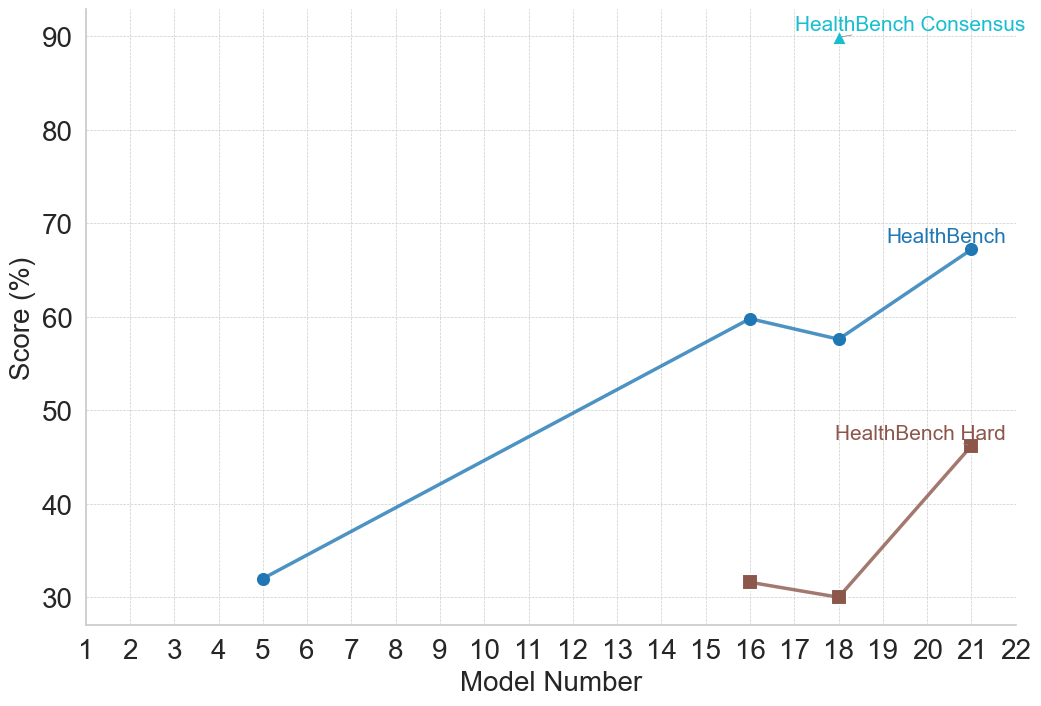
This is a line chart comparing the performance scores (in percentage) of three different evaluation benchmarks—HealthBench Consensus, HealthBench, and HealthBench Hard—across a series of model numbers. The chart illustrates how scores change as the model number increases, suggesting a progression or iteration of models.
### Components/Axes
* **Chart Type:** Line chart with markers.
* **X-Axis (Horizontal):**
* **Label:** "Model Number"
* **Scale:** Linear, ranging from 1 to 22, with major tick marks at every integer.
* **Y-Axis (Vertical):**
* **Label:** "Score (%)"
* **Scale:** Linear, ranging from 30 to 90, with major tick marks at intervals of 10 (30, 40, 50, 60, 70, 80, 90).
* **Legend:** Positioned in the top-right quadrant of the chart area.
* **HealthBench Consensus:** Represented by a cyan (light blue) upward-pointing triangle marker.
* **HealthBench:** Represented by a blue line with circular markers.
* **HealthBench Hard:** Represented by a brown line with square markers.
### Detailed Analysis
**1. HealthBench Consensus (Cyan Triangle)**
* **Data Points:** A single data point.
* **Value:** At Model Number 18, the score is approximately 90%.
* **Trend:** Not applicable (single point).
**2. HealthBench (Blue Line, Circular Markers)**
* **Trend:** The line shows a general upward trend from Model 5 to Model 21, with a slight dip between Models 16 and 18.
* **Data Points (Approximate):**
* Model 5: ~32%
* Model 16: ~60%
* Model 18: ~58%
* Model 21: ~67%
**3. HealthBench Hard (Brown Line, Square Markers)**
* **Trend:** The line shows a slight decline from Model 16 to Model 18, followed by a sharp increase to Model 21.
* **Data Points (Approximate):**
* Model 16: ~32%
* Model 18: ~30%
* Model 21: ~46%
### Key Observations
1. **Performance Hierarchy:** There is a clear and consistent performance gap between the three benchmarks. "HealthBench Consensus" yields the highest score (~90%), followed by "HealthBench" (peaking at ~67%), with "HealthBench Hard" being the most challenging (peaking at ~46%).
2. **Model Progression:** For the two line-based benchmarks, performance generally improves with higher model numbers, indicating that later models (e.g., 21) outperform earlier ones (e.g., 5, 16).
3. **Divergence at Model 21:** The performance gap between "HealthBench" and "HealthBench Hard" widens significantly at Model 21. While "HealthBench" sees a ~9 percentage point increase from Model 18, "HealthBench Hard" sees a much larger ~16 percentage point increase.
4. **Anomaly at Model 18:** Both "HealthBench" and "HealthBench Hard" show a performance dip or stagnation at Model 18 compared to Model 16, before recovering strongly at Model 21.
### Interpretation
The data suggests a few key insights:
* **Benchmark Difficulty:** The names are indicative of their difficulty. "Hard" is indeed the most difficult, "Consensus" appears to be the easiest (possibly representing an agreement among simpler models or a less stringent evaluation), and the standard "HealthBench" sits in the middle.
* **Model Improvement:** The overall upward trend for the two main benchmarks indicates that the underlying models are improving over successive iterations (higher model numbers). The sharp rise from Model 18 to 21 is particularly notable.
* **Nature of Improvement:** The fact that "HealthBench Hard" improves more dramatically at Model 21 than the standard "HealthBench" suggests that the latest model's advancements are especially effective at tackling more complex or nuanced medical/health-related tasks that the "Hard" benchmark is designed to test. The dip at Model 18 could indicate a model version that was optimized for different criteria or encountered a specific challenge present in the benchmark at that point.
* **Benchmark Relationship:** The "Consensus" score being a single, high point may represent a target or an aggregated score from an ensemble, serving as a high-water mark for performance. The two line charts likely track the performance of individual model versions against two different evaluation sets of varying difficulty.