## Line Chart: I-Don't-Know Rate vs. Layer for Llama-3-8B and Llama-3-70B
### Overview
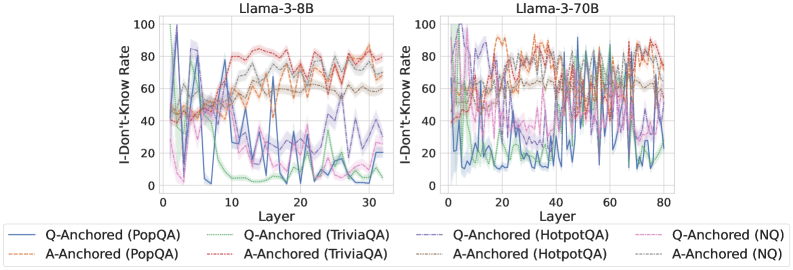
The image presents two line charts comparing the "I-Don't-Know Rate" across different layers of two language models: Llama-3-8B and Llama-3-70B. Each chart plots the rate for various question-answering datasets (PopQA, TriviaQA, HotpotQA, and NQ) using both question-anchored (Q-Anchored) and answer-anchored (A-Anchored) approaches. The x-axis represents the layer number, and the y-axis represents the I-Don't-Know Rate, ranging from 0 to 100.
### Components/Axes
* **Titles:**
* Left Chart: "Llama-3-8B"
* Right Chart: "Llama-3-70B"
* **X-axis (Layer):**
* Left Chart: Ranges from 0 to 30, with ticks at approximately 0, 10, 20, and 30.
* Right Chart: Ranges from 0 to 80, with ticks at approximately 0, 20, 40, 60, and 80.
* **Y-axis (I-Don't-Know Rate):**
* Both Charts: Ranges from 0 to 100, with ticks at 0, 20, 40, 60, 80, and 100.
* **Legend (Bottom):**
* Q-Anchored (PopQA): Solid Blue Line
* A-Anchored (PopQA): Dashed Brown Line
* Q-Anchored (TriviaQA): Dotted Green Line
* A-Anchored (TriviaQA): Dash-Dotted Pink Line
* Q-Anchored (HotpotQA): Solid Orange Line
* A-Anchored (HotpotQA): Dashed Gray Line
* Q-Anchored (NQ): Dotted Red Line
* A-Anchored (NQ): Dash-Dotted Black Line
### Detailed Analysis or ### Content Details
**Left Chart (Llama-3-8B):**
* **Q-Anchored (PopQA) (Solid Blue):** Starts high (around 50-60) and generally decreases with fluctuations, ending around 20.
* Values: Layer 0: ~55, Layer 10: ~50, Layer 20: ~30, Layer 30: ~20
* **A-Anchored (PopQA) (Dashed Brown):** Relatively stable, fluctuating between 60 and 80.
* Values: Layer 0: ~50, Layer 10: ~75, Layer 20: ~70, Layer 30: ~75
* **Q-Anchored (TriviaQA) (Dotted Green):** Starts high (near 100) and rapidly decreases to near 0, remaining low.
* Values: Layer 0: ~100, Layer 5: ~10, Layer 10: ~5, Layer 30: ~5
* **A-Anchored (TriviaQA) (Dash-Dotted Pink):** Starts around 40, decreases to near 0, then fluctuates between 0 and 20.
* Values: Layer 0: ~40, Layer 5: ~10, Layer 10: ~20, Layer 30: ~10
* **Q-Anchored (HotpotQA) (Solid Orange):** Starts around 50, increases and fluctuates between 60 and 80.
* Values: Layer 0: ~50, Layer 10: ~70, Layer 20: ~75, Layer 30: ~70
* **A-Anchored (HotpotQA) (Dashed Gray):** Starts around 50, increases and fluctuates between 60 and 80.
* Values: Layer 0: ~50, Layer 10: ~65, Layer 20: ~70, Layer 30: ~65
* **Q-Anchored (NQ) (Dotted Red):** Starts around 50, increases and fluctuates between 60 and 80.
* Values: Layer 0: ~50, Layer 10: ~75, Layer 20: ~70, Layer 30: ~75
* **A-Anchored (NQ) (Dash-Dotted Black):** Starts around 50, increases and fluctuates between 60 and 80.
* Values: Layer 0: ~50, Layer 10: ~60, Layer 20: ~70, Layer 30: ~65
**Right Chart (Llama-3-70B):**
* **Q-Anchored (PopQA) (Solid Blue):** Starts high (around 60) and generally decreases with fluctuations, ending around 20.
* Values: Layer 0: ~60, Layer 20: ~30, Layer 40: ~20, Layer 60: ~20, Layer 80: ~20
* **A-Anchored (PopQA) (Dashed Brown):** Relatively stable, fluctuating between 60 and 80.
* Values: Layer 0: ~50, Layer 20: ~75, Layer 40: ~70, Layer 60: ~75, Layer 80: ~75
* **Q-Anchored (TriviaQA) (Dotted Green):** Starts high (near 100) and rapidly decreases to near 0, remaining low.
* Values: Layer 0: ~100, Layer 10: ~10, Layer 20: ~5, Layer 80: ~5
* **A-Anchored (TriviaQA) (Dash-Dotted Pink):** Starts around 40, decreases to near 0, then fluctuates between 0 and 20.
* Values: Layer 0: ~40, Layer 10: ~10, Layer 20: ~20, Layer 80: ~10
* **Q-Anchored (HotpotQA) (Solid Orange):** Starts around 50, increases and fluctuates between 60 and 80.
* Values: Layer 0: ~50, Layer 20: ~70, Layer 40: ~75, Layer 60: ~70, Layer 80: ~70
* **A-Anchored (HotpotQA) (Dashed Gray):** Starts around 50, increases and fluctuates between 60 and 80.
* Values: Layer 0: ~50, Layer 20: ~65, Layer 40: ~70, Layer 60: ~65, Layer 80: ~65
* **Q-Anchored (NQ) (Dotted Red):** Starts around 50, increases and fluctuates between 60 and 80.
* Values: Layer 0: ~50, Layer 20: ~75, Layer 40: ~70, Layer 60: ~75, Layer 80: ~75
* **A-Anchored (NQ) (Dash-Dotted Black):** Starts around 50, increases and fluctuates between 60 and 80.
* Values: Layer 0: ~50, Layer 20: ~60, Layer 40: ~70, Layer 60: ~65, Layer 80: ~65
### Key Observations
* For both models, the "I-Don't-Know Rate" for TriviaQA (Q-Anchored and A-Anchored) drops significantly and remains low across all layers.
* The "I-Don't-Know Rate" for PopQA (Q-Anchored) tends to decrease as the layer increases.
* The "I-Don't-Know Rate" for PopQA (A-Anchored), HotpotQA (Q-Anchored and A-Anchored), and NQ (Q-Anchored and A-Anchored) remains relatively stable and high across all layers.
* The Llama-3-70B model has a longer x-axis (more layers) compared to Llama-3-8B.
### Interpretation
The charts illustrate how the "I-Don't-Know Rate" varies across different layers of the Llama-3-8B and Llama-3-70B models for different question-answering datasets and anchoring methods. The consistent low rate for TriviaQA suggests that both models are more confident in answering questions from this dataset, regardless of the layer. The decreasing rate for Q-Anchored PopQA indicates that the model becomes more certain about PopQA questions as it processes through deeper layers. The relatively stable and high rates for other datasets suggest that the model's confidence in answering those questions does not significantly change with increasing layer depth. The longer x-axis for Llama-3-70B indicates that it has more layers than Llama-3-8B, which could contribute to its potentially better performance in certain tasks.