\n
## Diagram: Ternary Diagram and Associated Flow
### Overview
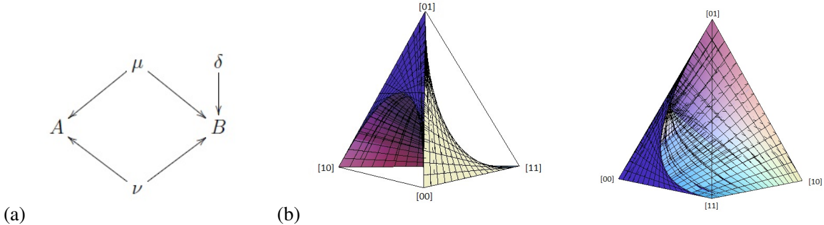
The image presents three related diagrams. Diagram (a) is a directed graph illustrating a flow between elements A and B. Diagrams (b) and (c) are ternary diagrams, visually representing compositions of three components. The diagrams appear to be related to a system where components are transformed or related through the flow depicted in (a).
### Components/Axes
* **Diagram (a):**
* Nodes: A, B, ν (nu)
* Directed Edges: A → ν, ν → B, A → B, B → ν.
* Edge Labels: μ (mu), δ (delta)
* **Diagrams (b) & (c):**
* Axes: Represented by coordinates [00], [01], [10], and [11]. These likely represent proportions or concentrations of three components.
* The diagrams are triangular, with the corners representing 100% concentration of one component and 0% of the others.
* The diagrams are shaded to indicate varying values or concentrations within the triangle.
### Detailed Analysis or Content Details
* **Diagram (a):**
* The diagram shows a flow from A to ν, from ν to B, and directly from A to B and B to ν.
* The edge from A to ν is labeled 'μ', and the edge from ν to B is labeled 'δ'. The other edges are unlabeled.
* The diagram suggests a system with interconnected transformations or relationships between A, B, and ν.
* **Diagram (b):**
* The diagram is a ternary plot. The color gradient ranges from dark red/purple at the [00] corner to light yellow/white at the [11] corner, and blue at the [10] corner.
* The surface appears to be a curved plane within the ternary space.
* The diagram shows a gradient of values, with higher values concentrated towards the [11] corner and lower values towards the [00] corner.
* **Diagram (c):**
* Similar to (b), this is a ternary plot with a color gradient.
* The color gradient ranges from dark purple at the [00] corner to light blue/white at the [10] corner, and yellow/red at the [11] corner.
* The surface is also a curved plane, but with a different shape and gradient compared to diagram (b).
* The diagram shows a gradient of values, with higher values concentrated towards the [10] corner and lower values towards the [00] corner.
### Key Observations
* The ternary diagrams (b) and (c) represent different states or conditions within the same compositional space.
* The color gradients in the ternary diagrams indicate a continuous variation in the value or concentration of the components.
* The flow diagram (a) may represent the processes that lead to the different states shown in the ternary diagrams.
* The diagrams are visually connected, suggesting a relationship between the flow and the compositional changes.
### Interpretation
The image likely represents a system where components A, B, and ν interact. The flow diagram (a) illustrates the possible transformations or relationships between these components, with 'μ' and 'δ' potentially representing rates or probabilities of these transformations. The ternary diagrams (b) and (c) show the resulting compositions of the three components under different conditions or after different transformations.
The differences between diagrams (b) and (c) suggest that the system can reach different equilibrium states or exhibit different behaviors depending on the initial conditions or the specific parameters of the flow. The curved surfaces in the ternary diagrams indicate that the relationships between the components are not linear.
Without further context, it is difficult to determine the specific meaning of the components and the flow. However, the image suggests a complex system with interconnected elements and dynamic behavior. The diagrams could represent a chemical reaction, a biological process, or any other system where the composition of three components is important. The diagrams are likely used to visualize and analyze the behavior of the system under different conditions.