## Line Chart: Accuracy vs. Sample Size
### Overview
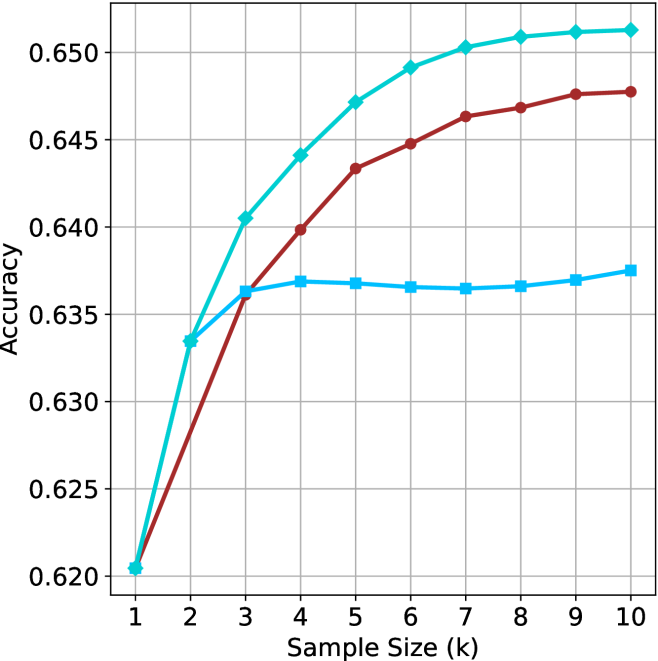
The image is a line chart comparing the accuracy of three different methods as a function of sample size (k). The x-axis represents the sample size, ranging from 1 to 10. The y-axis represents accuracy, ranging from 0.620 to 0.650. There are three distinct lines, each representing a different method, distinguished by color and marker shape.
### Components/Axes
* **X-axis:** Sample Size (k), ranging from 1 to 10 in integer increments.
* **Y-axis:** Accuracy, ranging from 0.620 to 0.650 in increments of 0.005.
* **Gridlines:** Present on the chart, aiding in value estimation.
* **Data Series:** Three data series are plotted.
* **Cyan line with diamond markers:** Represents the first method.
* **Brown line with circle markers:** Represents the second method.
* **Light blue line with square markers:** Represents the third method.
### Detailed Analysis
* **Cyan line with diamond markers:**
* At sample size 1, accuracy is approximately 0.620.
* At sample size 2, accuracy is approximately 0.633.
* At sample size 3, accuracy is approximately 0.640.
* At sample size 5, accuracy is approximately 0.647.
* At sample size 7, accuracy is approximately 0.651.
* At sample size 10, accuracy is approximately 0.651.
* Trend: This line shows a steep initial increase in accuracy, which gradually plateaus as the sample size increases.
* **Brown line with circle markers:**
* At sample size 1, accuracy is approximately 0.620.
* At sample size 2, accuracy is approximately 0.627.
* At sample size 3, accuracy is approximately 0.635.
* At sample size 5, accuracy is approximately 0.643.
* At sample size 7, accuracy is approximately 0.646.
* At sample size 10, accuracy is approximately 0.648.
* Trend: This line also shows an increase in accuracy with sample size, but the increase is less pronounced than the cyan line. It also plateaus, but at a lower accuracy level.
* **Light blue line with square markers:**
* At sample size 1, accuracy is approximately 0.620.
* At sample size 2, accuracy is approximately 0.636.
* At sample size 3, accuracy is approximately 0.637.
* At sample size 5, accuracy is approximately 0.637.
* At sample size 7, accuracy is approximately 0.637.
* At sample size 10, accuracy is approximately 0.637.
* Trend: This line shows a rapid initial increase, but quickly plateaus and remains relatively constant across the sample sizes.
### Key Observations
* The cyan line (with diamond markers) consistently shows the highest accuracy across all sample sizes.
* The light blue line (with square markers) plateaus at a lower accuracy level compared to the other two methods.
* All three methods start at approximately the same accuracy level (0.620) when the sample size is 1.
* The brown line (with circle markers) shows a moderate increase in accuracy before plateauing.
### Interpretation
The chart suggests that the method represented by the cyan line (with diamond markers) is the most effective in terms of accuracy, especially as the sample size increases. The method represented by the light blue line (with square markers) is the least effective, as its accuracy plateaus early and remains relatively low. The method represented by the brown line (with circle markers) offers a middle ground, with a moderate increase in accuracy before plateauing. The data implies that increasing the sample size beyond a certain point (around 5-7) yields diminishing returns for all three methods, as the accuracy plateaus.