## Diagram: Environmental Token Grounding Process
### Overview
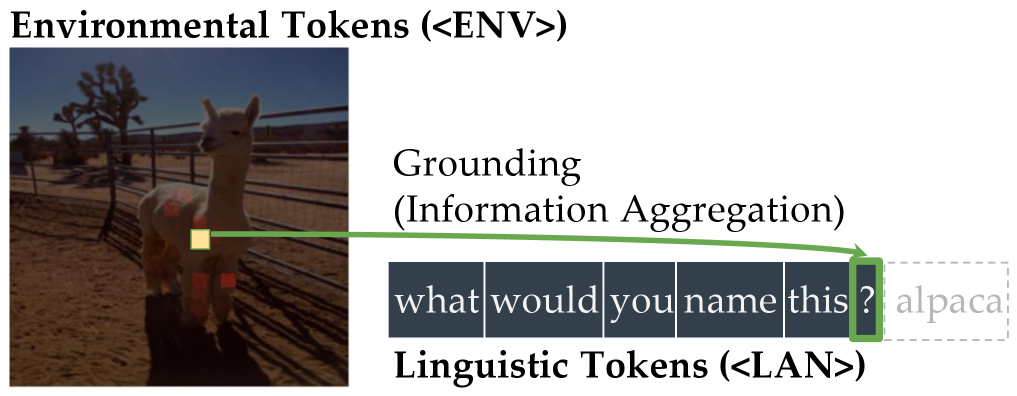
The diagram illustrates the relationship between environmental tokens (<ENV>) and linguistic tokens (<LAN>) through a grounding process called "Information Aggregation." It combines a visual representation of a llama with textual analysis and token segmentation.
### Components/Axes
1. **Visual Element**:
- Image of a llama in a fenced enclosure with desert vegetation
- Colored bounding boxes (red/yellow) on the llama's body
2. **Textual Component**:
- Question: "what would you name this ? alpaca"
- Words segmented into individual dark blue boxes
- Green box highlighting the question mark ("?")
3. **Connecting Element**:
- Green arrow from yellow box on llama to "this ?" in text
4. **Token Labels**:
- Environmental Tokens (<ENV>)
- Linguistic Tokens (<LAN>)
### Detailed Analysis
1. **Visual Annotation**:
- Red boxes: Likely represent environmental features (e.g., "desert", "fence")
- Yellow box: Highlights the llama as the primary subject
2. **Text Segmentation**:
- Each word in "what would you name this ? alpaca" is individually boxed
- Question mark ("?") emphasized with green box
3. **Token Flow**:
- Green arrow connects visual grounding (llama) to linguistic output ("alpaca")
- Suggests information flow from environmental context to language model
### Key Observations
1. The grounding process transforms visual input into structured linguistic tokens
2. The question mark acts as a critical junction between perception and language
3. Color coding differentiates token types:
- Red/Yellow: Environmental features
- Dark Blue: Linguistic tokens
- Green: Connection/grounding element
4. "alpaca" appears as the final output token, disconnected from the question structure
### Interpretation
This diagram demonstrates a multimodal grounding process where:
1. Environmental context (visual scene) is analyzed through tokenized features
2. The system generates a question ("what would you name this ?") to bridge perception and language
3. The question mark serves as the critical interface between visual and linguistic processing
4. The final output ("alpaca") emerges from aggregating environmental information through the grounding mechanism
The color-coded tokenization suggests a structured approach to:
- Spatial analysis (ENV tokens)
- Semantic decomposition (LAN tokens)
- Contextual integration (green arrow connection)
The absence of numerical values indicates this is a conceptual diagram rather than data visualization, focusing on process flow rather than quantitative analysis.