## Chart: Circular Distribution Function
### Overview
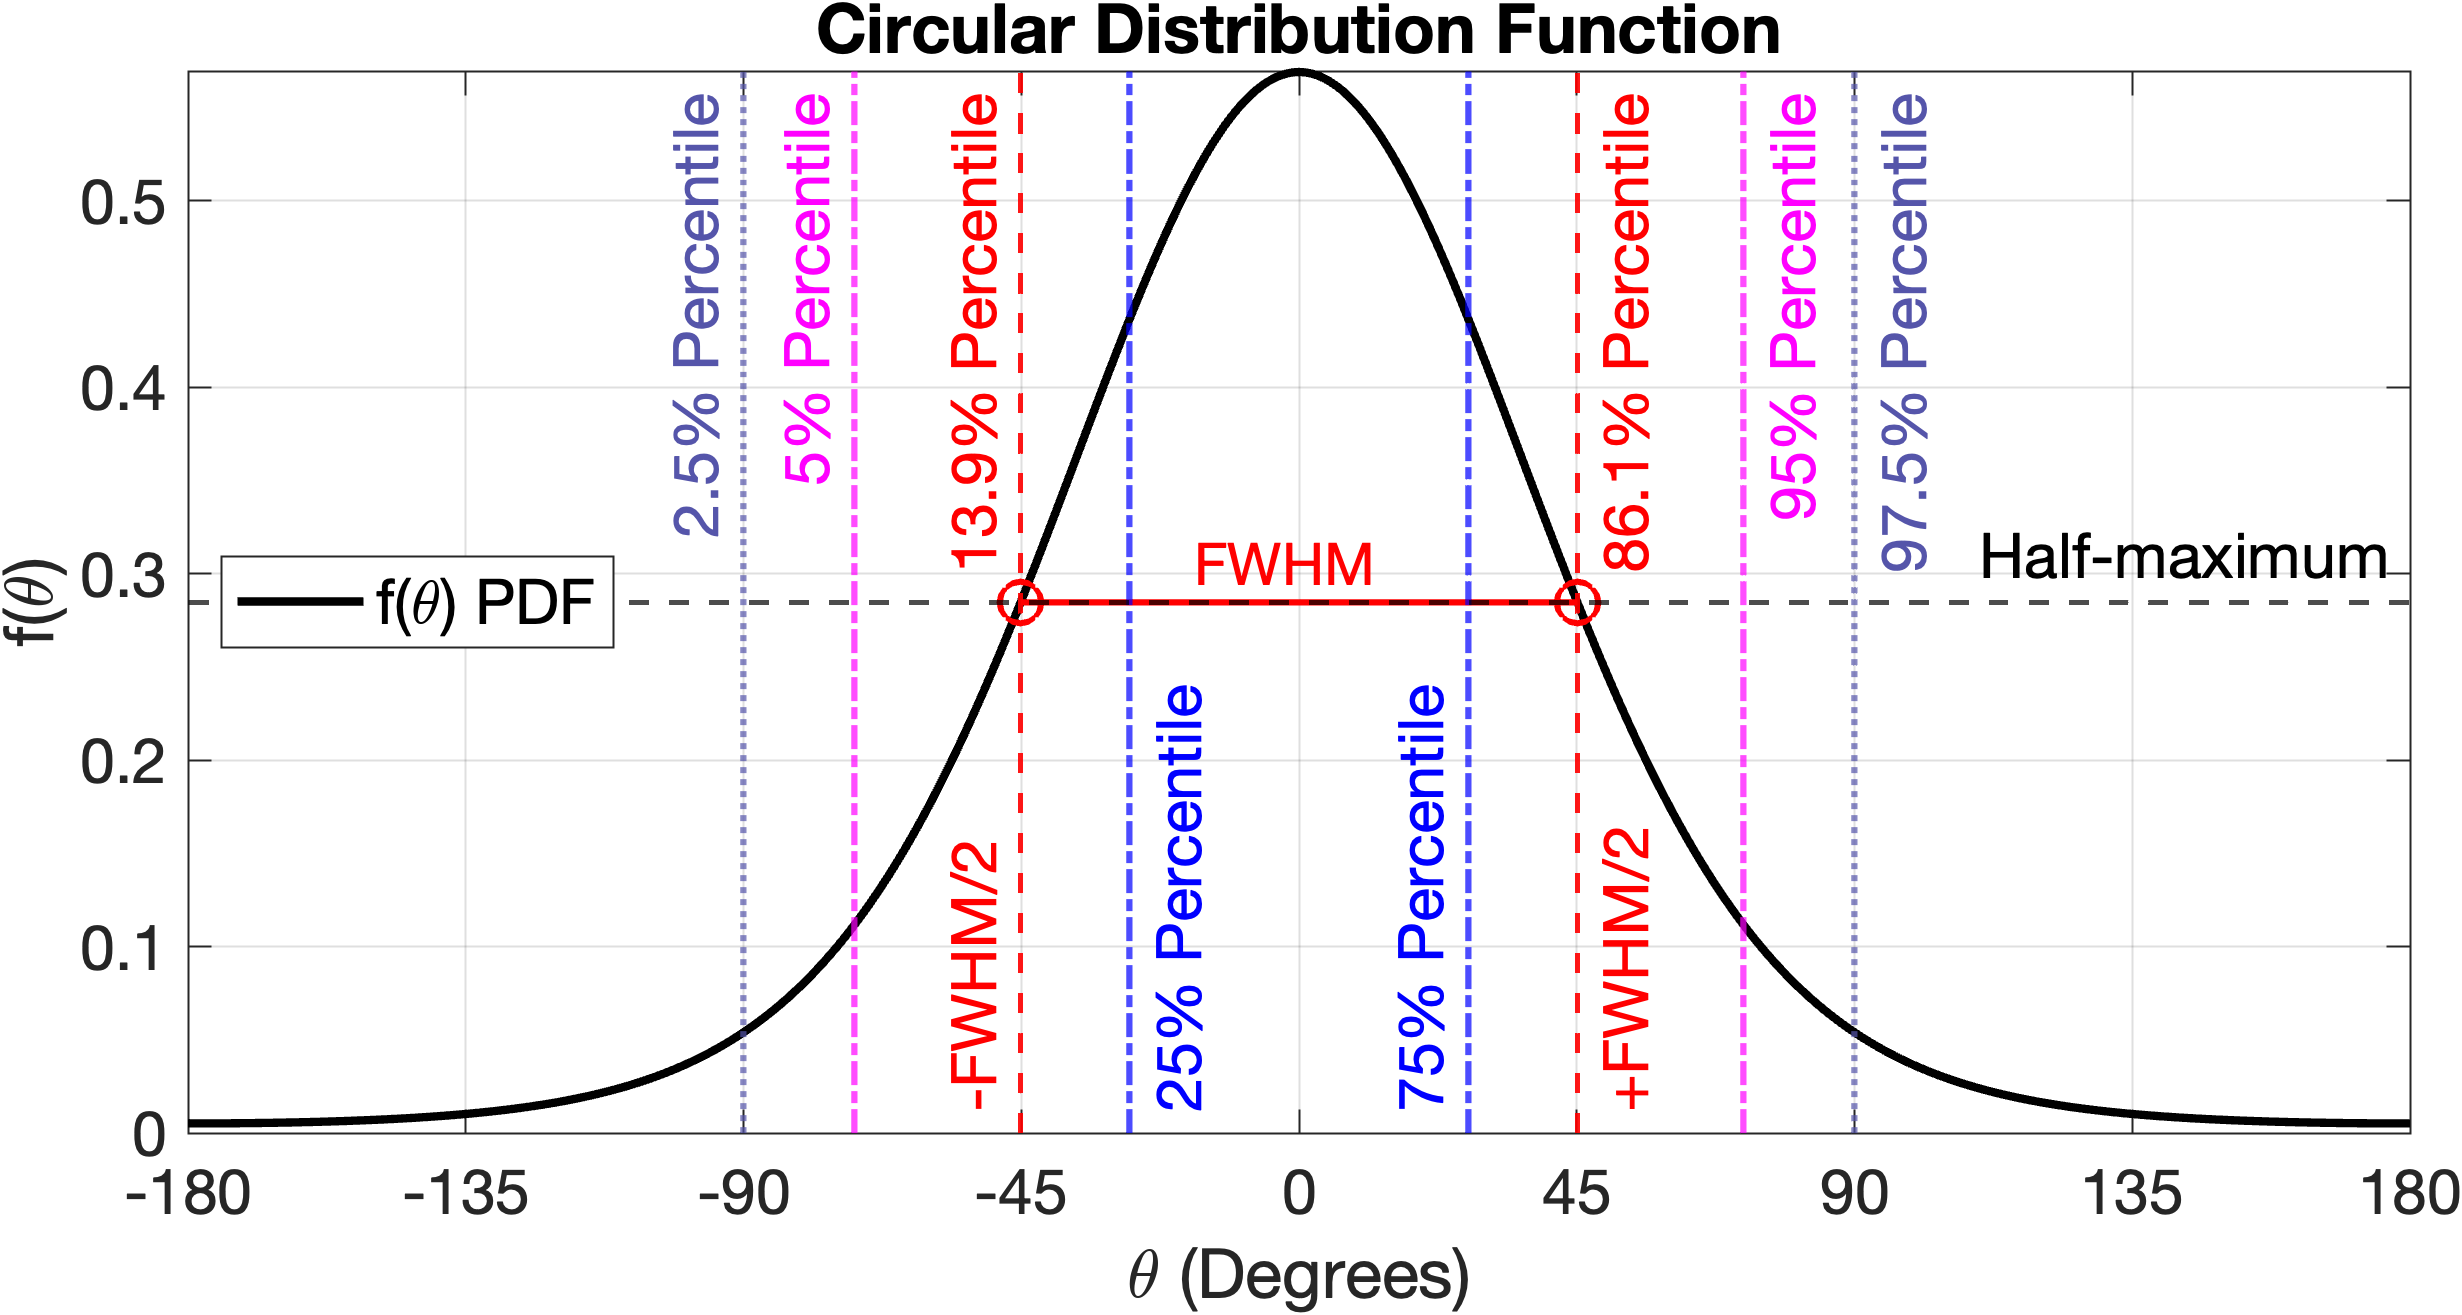
The chart depicts a symmetric bell-shaped probability density function (PDF) centered at 0 degrees, representing a circular distribution. Key features include percentile markers, full width at half maximum (FWHM), and half-maximum thresholds.
### Components/Axes
- **X-axis**: θ (Degrees), ranging from -180° to 180° in 45° increments.
- **Y-axis**: f(θ) PDF, scaled from 0 to 0.5.
- **Legend**:
- Black line: "f(θ) PDF" (probability density function).
- **Vertical Lines**:
- Dashed blue lines at -90°, -45°, 0°, 45°, 90°, and 135°.
- Red dashed lines at -45° and 45° labeled "-FWHM/2" and "+FWHM/2".
- Dotted purple lines at -90° and 90° labeled "2.5% Percentile" and "97.5% Percentile".
- Dotted pink lines at -45° and 45° labeled "5% Percentile" and "95% Percentile".
- **Annotations**:
- "FWHM" at the peak (0°).
- "Half-maximum" at y = 0.3 (dashed horizontal line).
### Detailed Analysis
- **Percentile Markers**:
- 2.5%: -90° (left tail).
- 5%: -45° (left tail).
- 25%: 0° (center).
- 75%: 45° (right tail).
- 95%: 45° (right tail).
- 97.5%: 90° (right tail).
- **FWHM**:
- Full width at half maximum spans from -45° to +45° (red dashed lines).
- Half-maximum threshold at y = 0.3 (dashed line).
- **Symmetry**: The curve is symmetric about θ = 0°, with identical slopes on both sides.
### Key Observations
1. The distribution peaks sharply at 0°, with f(θ) ≈ 0.5.
2. 99.7% of the distribution lies within ±90° (2.5% and 97.5% percentiles).
3. The FWHM (90° total width) captures 50% of the distribution (area under the curve between -45° and +45°).
4. The half-maximum line (y = 0.3) intersects the curve at approximately ±67.5° (interpolated from the bell shape).
### Interpretation
This chart models a circular distribution with a unimodal, symmetric PDF. The FWHM (90°) quantifies the spread of the central 50% of data, while percentiles demarcate cumulative probabilities. The half-maximum threshold (y = 0.3) provides a secondary measure of spread, indicating where the density drops to half its peak value. The symmetry suggests no directional bias in the data, and the sharp peak at 0° implies a strong central tendency. The use of percentile markers aligns with standard statistical practice for characterizing distributions.