## Maze Navigation Diagram
### Overview
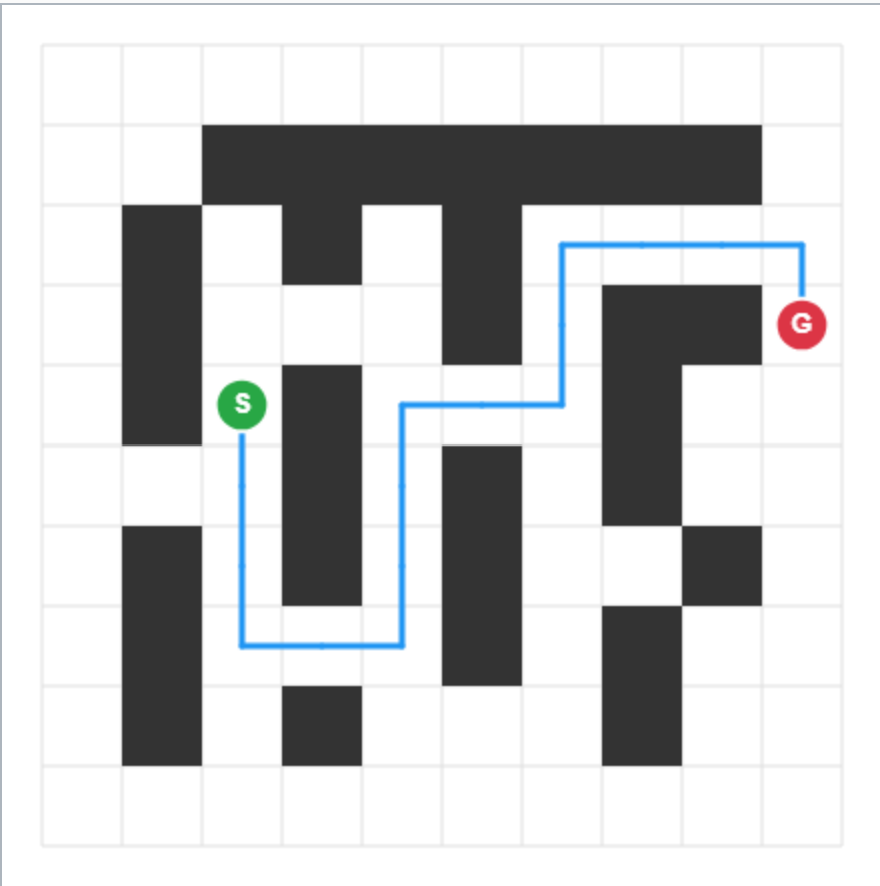
The image depicts a maze with a solution path highlighted. The maze consists of black blocks representing walls and white blocks representing open space. A blue line indicates the path from the starting point (marked with a green "S") to the goal (marked with a red "G"). The maze is overlaid on a light gray grid.
### Components/Axes
* **Maze:** A grid of black and white squares representing walls and open paths, respectively.
* **Start Point (S):** A green circle containing the letter "S", located on the left side of the maze.
* **Goal Point (G):** A red circle containing the letter "G", located on the right side of the maze.
* **Solution Path:** A blue line indicating the path from the start point to the goal point.
* **Grid:** A light gray grid providing a visual reference for the maze structure.
### Detailed Analysis
The maze is approximately 10x10 grid cells. The start point "S" is located at approximately (2,5) in grid coordinates, where (0,0) is the top-left corner. The goal point "G" is located at approximately (8,2).
The blue solution path starts at "S" and moves:
1. Down one cell.
2. Right two cells.
3. Up four cells.
4. Right two cells.
5. Down two cells.
6. Right one cell.
7. Up two cells.
8. Right one cell to reach "G".
The black blocks form a complex arrangement of walls, creating a non-trivial path between "S" and "G".
### Key Observations
* The solution path is not a straight line; it requires multiple turns to navigate the maze.
* The maze has several dead ends and blocked pathways.
* The solution path appears to be the shortest possible route through the maze.
### Interpretation
The diagram illustrates a pathfinding problem and a possible solution. The maze represents a complex environment, and the blue line represents a successful navigation strategy. The presence of the start and goal points, along with the solution path, suggests a problem-solving scenario where an agent needs to find the optimal route between two points in a constrained environment. The diagram could be used to demonstrate pathfinding algorithms or to visualize the complexity of navigating a maze.