## Bar Chart: Tool Usage Frequency Distribution
### Overview
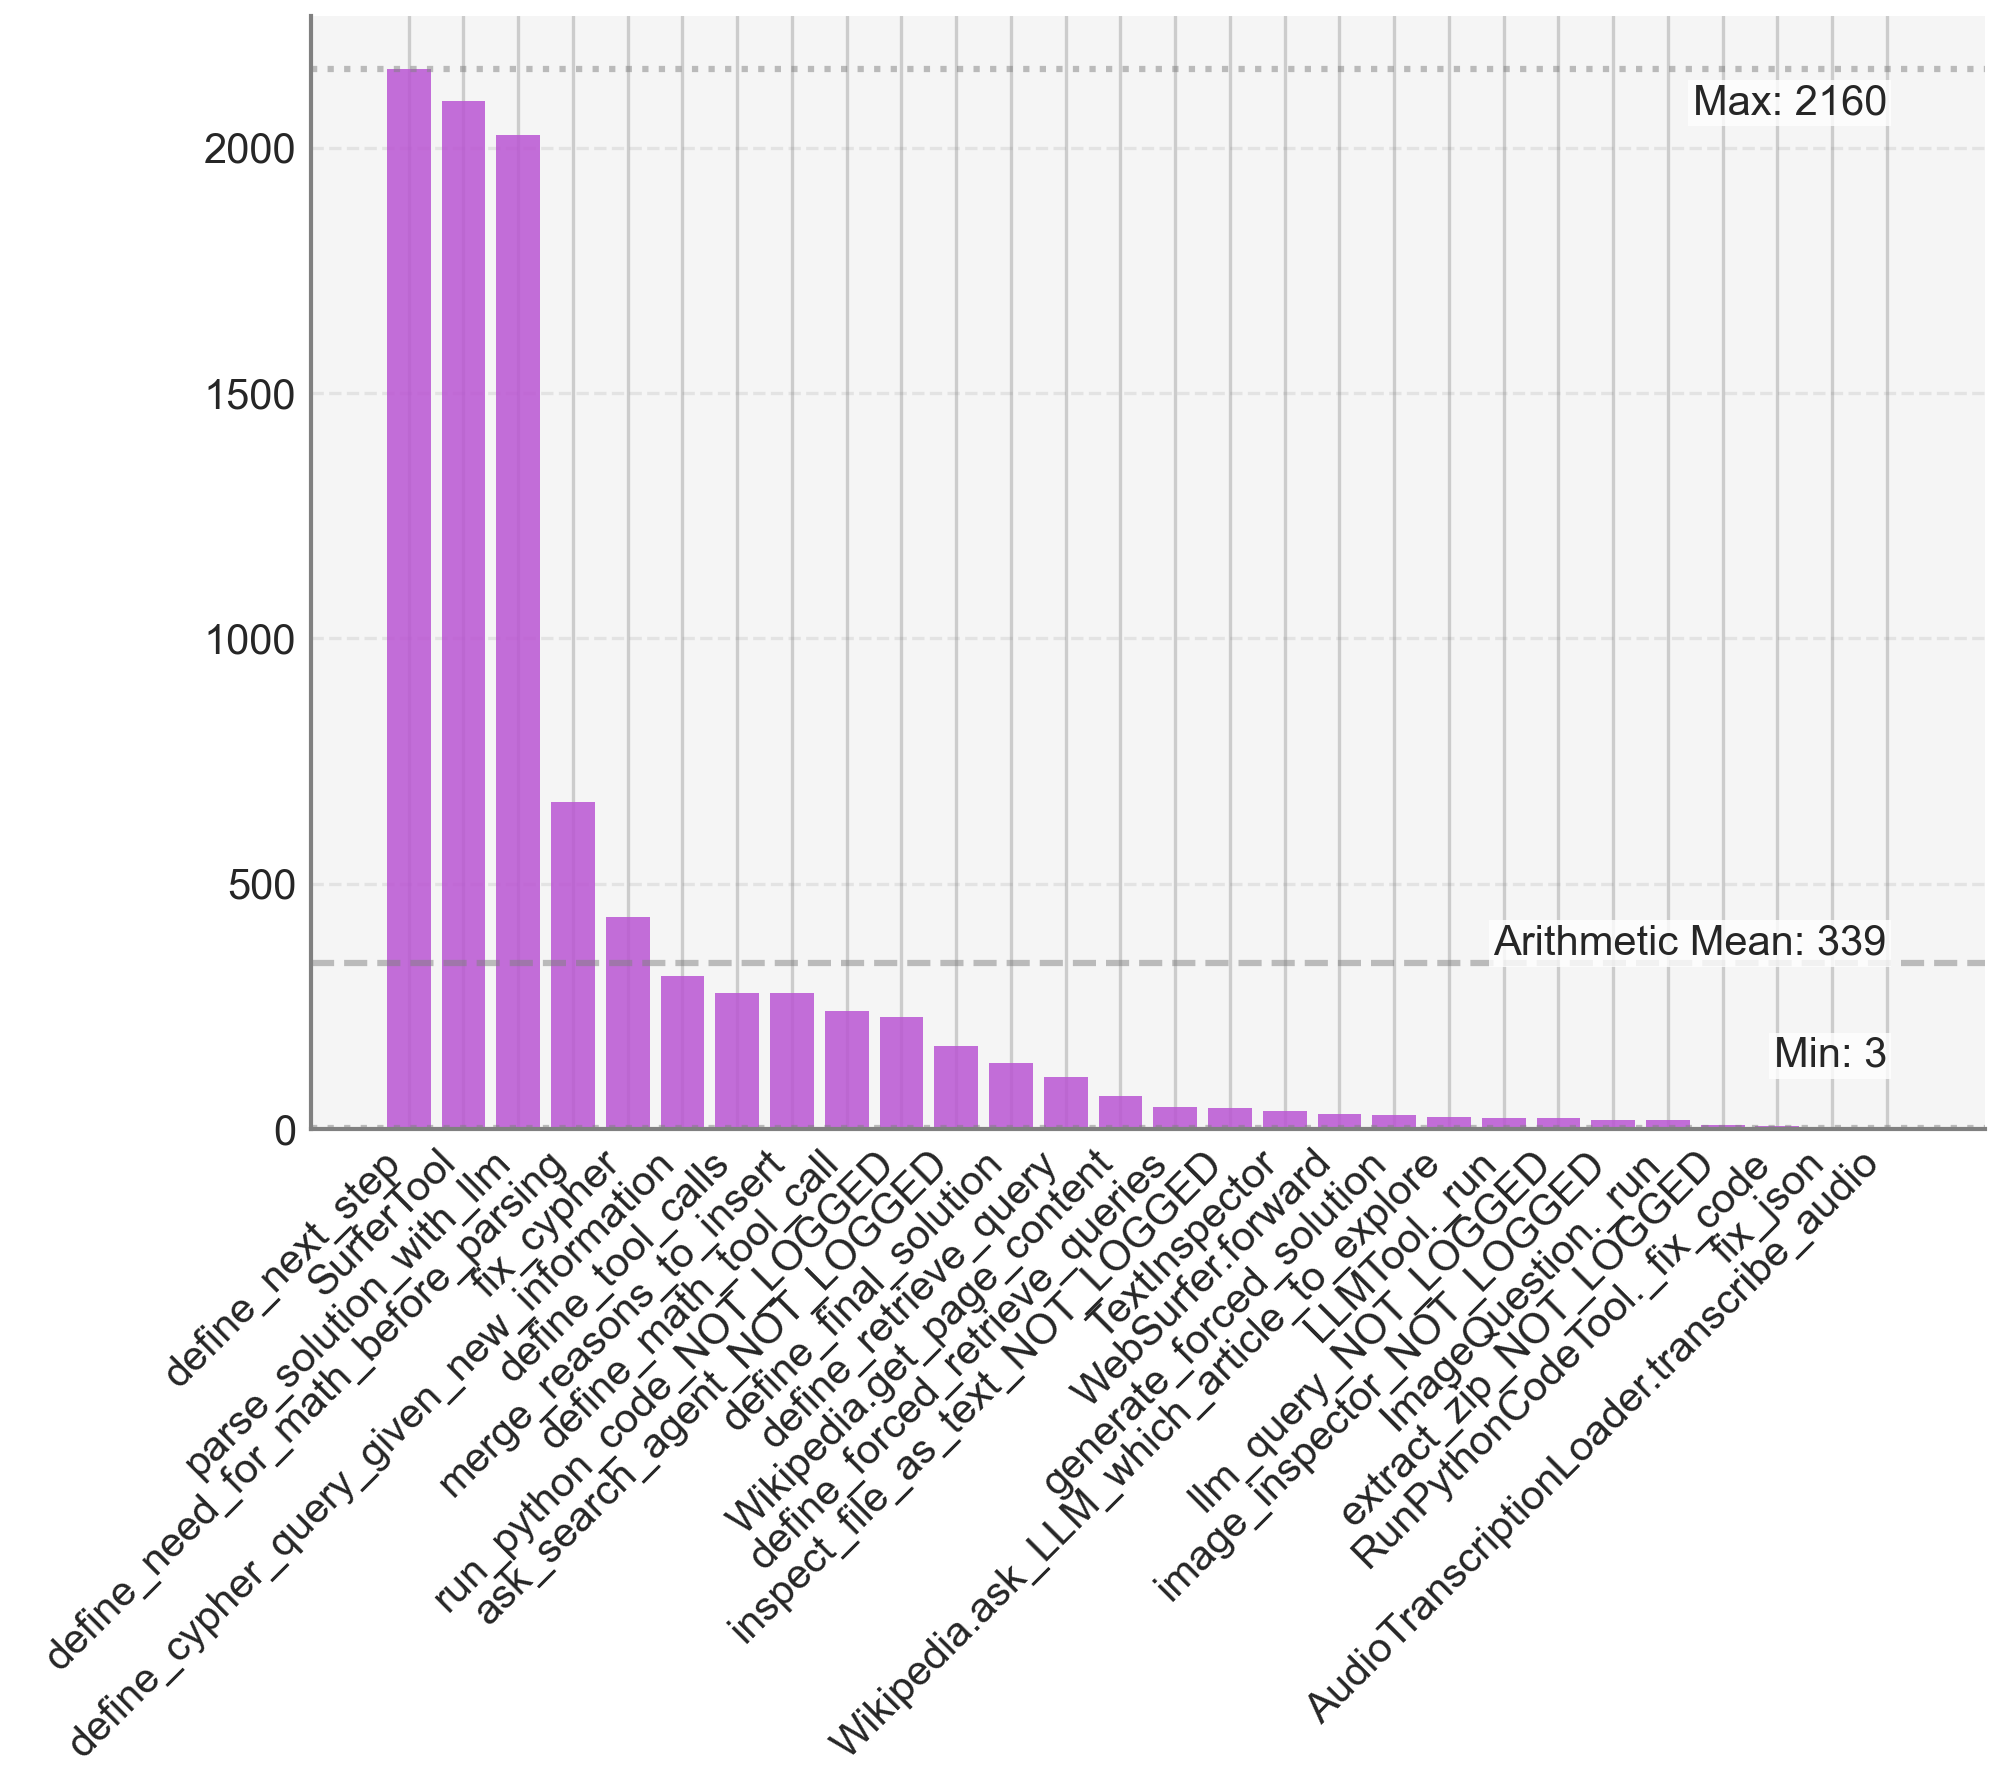
This image is a vertical bar chart displaying the frequency or count of various tool names, likely from an AI agent or automation system. The chart shows a highly skewed distribution, with a few tools having very high counts and a long tail of tools with very low counts. The data is presented against a light gray grid background.
### Components/Axes
* **Chart Type:** Vertical Bar Chart.
* **X-Axis (Horizontal):** Lists the names of various tools or functions. The labels are rotated approximately 45 degrees for readability. The complete list of tool names, from left to right, is:
1. `define_next_step`
2. `SurferTool`
3. `parse_solution_with_llm`
4. `define_need_for_math_before_parsing`
5. `fix_cypher`
6. `define_cypher_query_given_new_information`
7. `define_tool_calls`
8. `merge_reasons_to_insert`
9. `define_math_tool_call`
10. `run_python_code_NOT_LOGGED`
11. `ask_search_agent_NOT_LOGGED`
12. `define_final_solution`
13. `define_retrieve_query`
14. `Wikipedia.get_page_content`
15. `define_forced_retrieve_queries`
16. `inspect_file_as_text_NOT_LOGGED`
17. `TextInspector`
18. `WebSurfer.forward`
19. `generate_forced_solution`
20. `Wikipedia.ask_LLM_which_article_to_explore`
21. `LLMTool.run`
22. `llm_query_NOT_LOGGED`
23. `image_inspector_NOT_LOGGED`
24. `ImageQuestion.run`
25. `extract_zip_NOT_LOGGED`
26. `RunPythonCodeTool._fix_code`
27. `fix_json`
28. `AudioTranscriptionLoader.transcribe_audio`
* **Y-Axis (Vertical):** Represents a numerical count, with major gridlines and labels at 0, 500, 1000, 1500, and 2000. The axis extends slightly beyond 2000.
* **Legend/Annotations:** There are three horizontal dashed lines with annotations placed on the right side of the chart:
* **Top (Dotted Line):** "Max: 2160" - Indicates the maximum value in the dataset.
* **Middle (Dashed Line):** "Arithmetic Mean: 339" - Indicates the average value.
* **Bottom (Dashed Line):** "Min: 3" - Indicates the minimum value.
### Detailed Analysis
The bars are all a uniform purple color. Their heights, estimated from the y-axis scale, are as follows (values are approximate):
1. `define_next_step`: ~2160 (Matches the "Max" annotation)
2. `SurferTool`: ~2050
3. `parse_solution_with_llm`: ~2000
4. `define_need_for_math_before_parsing`: ~650
5. `fix_cypher`: ~430
6. `define_cypher_query_given_new_information`: ~300
7. `define_tool_calls`: ~270
8. `merge_reasons_to_insert`: ~270
9. `define_math_tool_call`: ~240
10. `run_python_code_NOT_LOGGED`: ~230
11. `ask_search_agent_NOT_LOGGED`: ~160
12. `define_final_solution`: ~120
13. `define_retrieve_query`: ~90
14. `Wikipedia.get_page_content`: ~60
15. `define_forced_retrieve_queries`: ~40
16. `inspect_file_as_text_NOT_LOGGED`: ~30
17. `TextInspector`: ~25
18. `WebSurfer.forward`: ~20
19. `generate_forced_solution`: ~15
20. `Wikipedia.ask_LLM_which_article_to_explore`: ~10
21. `LLMTool.run`: ~8
22. `llm_query_NOT_LOGGED`: ~7
23. `image_inspector_NOT_LOGGED`: ~6
24. `ImageQuestion.run`: ~5
25. `extract_zip_NOT_LOGGED`: ~4
26. `RunPythonCodeTool._fix_code`: ~4
27. `fix_json`: ~3 (Matches the "Min" annotation)
28. `AudioTranscriptionLoader.transcribe_audio`: ~3 (Matches the "Min" annotation)
**Trend Verification:** The visual trend is a steep, descending slope from left to right. The first three bars form a high plateau, followed by a sharp drop at the fourth bar. The remaining bars form a long, gradually descending tail, with the last several bars being barely visible above the zero line.
### Key Observations
1. **Extreme Skew:** The distribution is heavily right-skewed. The top three tools (`define_next_step`, `SurferTool`, `parse_solution_with_llm`) account for a disproportionately large share of the total count.
2. **Significant Drop-off:** There is a dramatic decrease in frequency after the third tool. The fourth tool's count is less than a third of the third tool's count.
3. **Long Tail:** The majority of the tools (20 out of 28) have counts below the arithmetic mean of 339. The last 10 tools all have counts in the single digits.
4. **Core vs. Peripheral Tools:** The chart suggests a clear hierarchy of tool usage, with a small set of core, frequently-invoked tools and a large set of specialized or rarely-used tools.
### Interpretation
This chart likely visualizes the usage frequency of different functions or modules within an AI agent's toolkit over a specific period or set of tasks. The data suggests that the agent's operation is dominated by a few fundamental activities: defining the next step (`define_next_step`), using a web or information surfing tool (`SurferTool`), and parsing solutions with a language model (`parse_solution_with_llm`). These could represent the core reasoning and information-gathering loop of the agent.
The sharp drop-off indicates that other tools, while necessary, are invoked far less frequently. The long tail of single-digit usage tools (`fix_json`, `AudioTranscriptionLoader.transcribe_audio`, etc.) represents highly specific, situational capabilities. The presence of many `_NOT_LOGGED` suffixed tools might indicate internal or debugging functions that are not part of the primary, logged workflow. The arithmetic mean (339) is heavily influenced by the high-value outliers and is not representative of the typical tool's usage, which is better described by the median (which would be much lower, likely in the low hundreds). This distribution is characteristic of many complex systems where a small number of components handle the majority of the workload.