## Diagram: Cyclic Relationship
### Overview
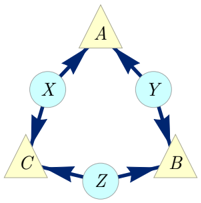
The image depicts a cyclic diagram showing relationships between six elements labeled A, B, C, X, Y, and Z. The diagram illustrates a circular flow or interaction between these elements, with directional arrows indicating the direction of the relationship.
### Components/Axes
* **Shapes:** The diagram uses two shapes: triangles and circles.
* Triangles are colored light yellow and labeled A, B, and C.
* Circles are colored light blue and labeled X, Y, and Z.
* **Arrows:** Dark blue arrows indicate the direction of the relationship between the elements.
* **Arrangement:** The elements are arranged in a circular pattern. The triangles (A, B, C) form the vertices of an equilateral triangle, and the circles (X, Y, Z) are positioned between the triangles.
### Detailed Analysis
* **Relationships:**
* X points to C.
* C points to Z.
* Z points to B.
* B points to Y.
* Y points to A.
* A points to X.
### Key Observations
The diagram shows a closed-loop relationship where each element influences the next in a specific sequence. The triangles and circles alternate in the cycle.
### Interpretation
The diagram illustrates a cyclic process or dependency between the elements A, B, C, X, Y, and Z. The arrows indicate the direction of influence or flow. This type of diagram is often used to represent feedback loops, circular dependencies, or cyclical processes in various systems. The alternating shapes (triangles and circles) might represent different types of entities or stages within the cycle.