## Heatmap: Task Success Rate by Category and Agent
### Overview
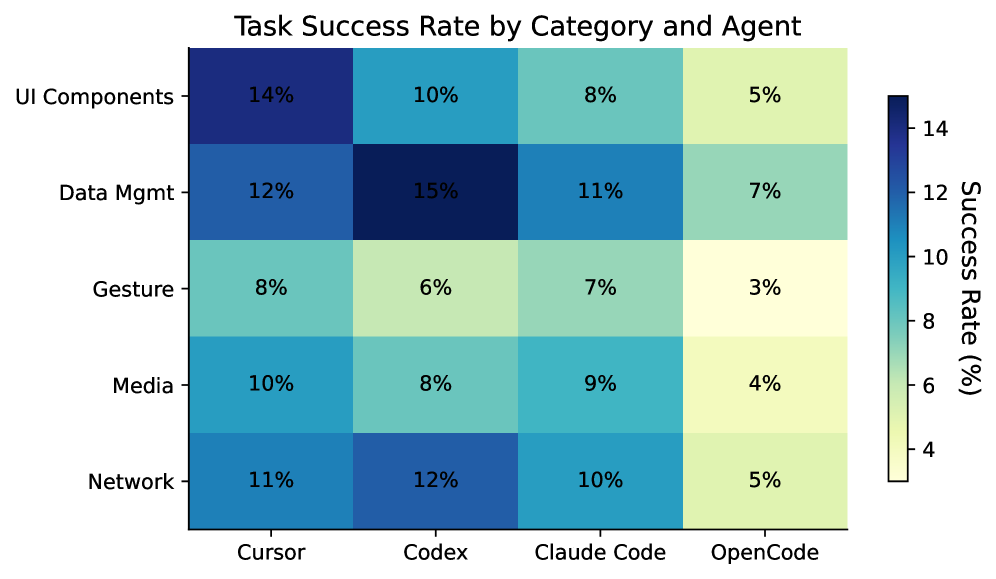
The image is a heatmap displaying the task success rate, in percentage, for different categories (UI Components, Data Mgmt, Gesture, Media, Network) across various agents (Cursor, Codex, Claude Code, OpenCode). The color intensity represents the success rate, with darker blues indicating higher success rates and lighter yellows indicating lower success rates.
### Components/Axes
* **Title:** Task Success Rate by Category and Agent
* **Y-axis (Categories):** UI Components, Data Mgmt, Gesture, Media, Network
* **X-axis (Agents):** Cursor, Codex, Claude Code, OpenCode
* **Color Scale (Success Rate %):** A vertical color bar on the right side of the heatmap indicates the success rate percentage. The scale ranges from approximately 4% (light yellow) to 14% (dark blue). The scale is marked at intervals of 4, 6, 8, 10, 12, and 14.
### Detailed Analysis
Here's a breakdown of the success rates for each category and agent:
* **UI Components:**
* Cursor: 14%
* Codex: 10%
* Claude Code: 8%
* OpenCode: 5%
* **Data Mgmt:**
* Cursor: 12%
* Codex: 15%
* Claude Code: 11%
* OpenCode: 7%
* **Gesture:**
* Cursor: 8%
* Codex: 6%
* Claude Code: 7%
* OpenCode: 3%
* **Media:**
* Cursor: 10%
* Codex: 8%
* Claude Code: 9%
* OpenCode: 4%
* **Network:**
* Cursor: 11%
* Codex: 12%
* Claude Code: 10%
* OpenCode: 5%
### Key Observations
* Codex has the highest success rate (15%) for Data Mgmt.
* OpenCode consistently has the lowest success rates across all categories.
* UI Components have the highest success rate with Cursor (14%).
* Gesture has the lowest success rate with OpenCode (3%).
### Interpretation
The heatmap provides a comparative analysis of task success rates across different categories and agents. The data suggests that Codex performs particularly well in Data Management tasks, while OpenCode generally underperforms across all categories. Cursor shows strong performance in UI Components. The heatmap allows for easy identification of strengths and weaknesses of each agent in specific task categories. The color gradient effectively highlights the variations in success rates, making it easy to identify high and low performance areas.