## Bar Chart: F1 and BLEU-1 Scores vs. k Values
### Overview
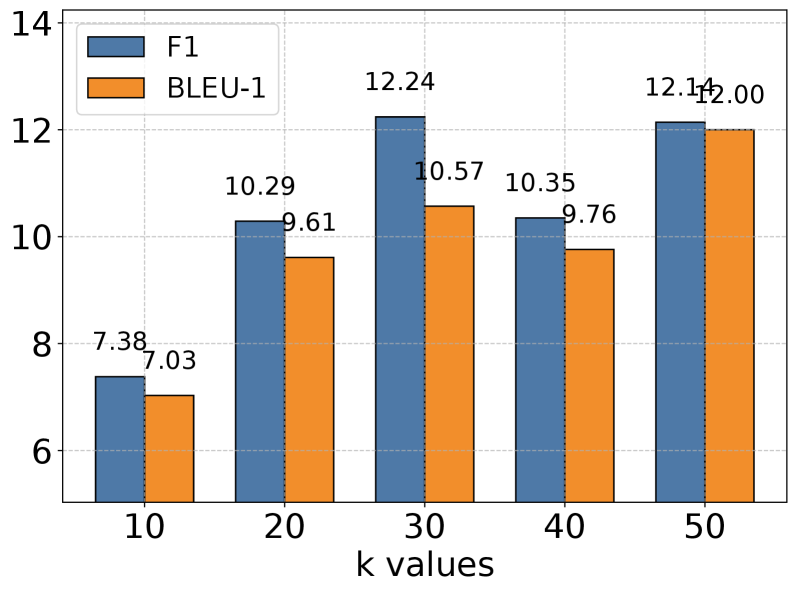
The image is a bar chart comparing F1 and BLEU-1 scores for different values of 'k'. The x-axis represents 'k values' ranging from 10 to 50, and the y-axis represents the score. Each 'k value' has two bars, one for F1 score (blue) and one for BLEU-1 score (orange). Numerical values are displayed above each bar.
### Components/Axes
* **X-axis:** 'k values' with markers at 10, 20, 30, 40, and 50.
* **Y-axis:** Score, ranging from 6 to 14. No explicit units are given.
* **Legend:** Located in the top-left corner.
* Blue bar: F1
* Orange bar: BLEU-1
* **Gridlines:** Horizontal gridlines are present at intervals of 2, starting from 6.
### Detailed Analysis
The chart presents F1 and BLEU-1 scores for k values of 10, 20, 30, 40, and 50.
* **k = 10:**
* F1 (blue): 7.38
* BLEU-1 (orange): 7.03
* **k = 20:**
* F1 (blue): 10.29
* BLEU-1 (orange): 9.61
* **k = 30:**
* F1 (blue): 12.24
* BLEU-1 (orange): 10.57
* **k = 40:**
* F1 (blue): 10.35
* BLEU-1 (orange): 9.76
* **k = 50:**
* F1 (blue): 12.11
* BLEU-1 (orange): 12.00
**Trends:**
* **F1 Score:** The F1 score generally increases from k=10 to k=30, then decreases at k=40, and increases again at k=50.
* **BLEU-1 Score:** The BLEU-1 score generally increases from k=10 to k=30, then decreases at k=40, and increases again at k=50.
### Key Observations
* For all k values, the F1 score is higher than the BLEU-1 score, except at k=50 where the BLEU-1 score is slightly lower.
* The highest F1 score is observed at k=30 (12.24).
* The highest BLEU-1 score is observed at k=50 (12.00).
* Both F1 and BLEU-1 scores show a similar trend, increasing initially, then decreasing, and increasing again.
### Interpretation
The chart compares the performance of a system using F1 and BLEU-1 metrics for different values of 'k'. The data suggests that increasing 'k' initially improves both F1 and BLEU-1 scores, but there's a point (around k=40) where performance dips before recovering at k=50. The optimal 'k' value, based on this data, appears to be around 30 for F1 and 50 for BLEU-1. The relationship between F1 and BLEU-1 is generally consistent, with F1 scores being slightly higher than BLEU-1 scores for most 'k' values. This could indicate that the system is better at balancing precision and recall (F1) than at matching n-grams (BLEU-1), except at k=50 where they are nearly equal.