## Chart: R1-Llama Accuracy vs. Ratio
### Overview
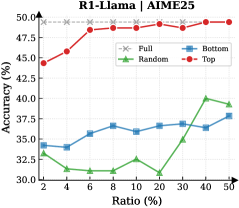
The image is a line chart comparing the accuracy of R1-Llama models (Full, Random, Bottom, and Top) against varying ratios, likely representing a data sampling or selection strategy. The x-axis represents the ratio in percentage, and the y-axis represents the accuracy in percentage.
### Components/Axes
* **Title:** R1-Llama | AIME25
* **X-axis:** Ratio (%)
* Values: 2, 4, 6, 8, 10, 20, 30, 40, 50
* **Y-axis:** Accuracy (%)
* Values: 30.0, 32.5, 35.0, 37.5, 40.0, 42.5, 45.0, 47.5, 50.0
* **Legend:** Located in the top-right corner.
* Full (gray dashed line with 'x' markers)
* Random (green line with triangle markers)
* Bottom (blue line with square markers)
* Top (red line with circle markers)
### Detailed Analysis
* **Full:** The gray dashed line with 'x' markers remains relatively constant at approximately 49% accuracy across all ratios.
* Ratio 2%: ~49%
* Ratio 50%: ~49%
* **Random:** The green line with triangle markers shows a decreasing trend from 2% to 8%, then increases significantly from 20% to 40%.
* Ratio 2%: ~33%
* Ratio 8%: ~31%
* Ratio 40%: ~40%
* Ratio 50%: ~38%
* **Bottom:** The blue line with square markers shows a slight increasing trend from 2% to 8%, then remains relatively stable until 30%, followed by a slight increase to 50%.
* Ratio 2%: ~34%
* Ratio 8%: ~36%
* Ratio 30%: ~37%
* Ratio 50%: ~39%
* **Top:** The red line with circle markers shows an increasing trend from 2% to 6%, then remains relatively stable with minor fluctuations.
* Ratio 2%: ~44%
* Ratio 6%: ~48%
* Ratio 50%: ~49%
### Key Observations
* The "Full" model consistently achieves the highest accuracy across all ratios.
* The "Top" model starts with a lower accuracy than "Full" but quickly approaches its performance.
* The "Random" model has the lowest accuracy, with significant fluctuations based on the ratio.
* The "Bottom" model's accuracy is consistently higher than the "Random" model but lower than the "Top" model.
### Interpretation
The chart illustrates the impact of different data selection strategies (Full, Random, Bottom, Top) on the accuracy of the R1-Llama model. The "Full" model, which presumably uses the entire dataset, provides the best and most stable performance. The "Top" model, which likely prioritizes certain data points, quickly approaches the "Full" model's accuracy. The "Random" model's performance is the most variable, suggesting that random sampling is not an effective strategy for this model. The "Bottom" model, which may prioritize less important data points, performs better than the "Random" model but not as well as the "Top" model. The data suggests that strategic data selection can significantly impact model accuracy, and using the full dataset or prioritizing certain data points leads to better performance.