\n
## Heatmaps: Three Comparative Distributions
### Overview
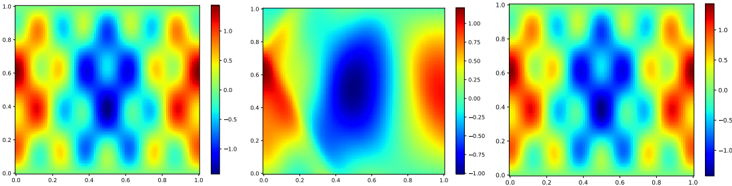
The image presents three separate heatmaps displayed side-by-side. Each heatmap visualizes a two-dimensional distribution of values, represented by a color gradient. The heatmaps share the same x and y axis scales, ranging from 0.0 to 1.0. The color scale on the right indicates the value range, from approximately -1.0 to 1.0. The heatmaps appear to depict a vaguely humanoid shape in the first and third images.
### Components/Axes
* **X-axis:** Ranges from 0.0 to 1.0.
* **Y-axis:** Ranges from 0.0 to 1.0.
* **Color Scale:** Ranges from approximately -1.0 (dark blue) to 1.0 (dark red), with intermediate colors representing values in between. The color scale is positioned on the right side of the middle heatmap.
* **Heatmap 1 (Left):** Displays a distribution with a humanoid shape.
* **Heatmap 2 (Center):** Displays a roughly elliptical distribution.
* **Heatmap 3 (Right):** Displays a distribution with a humanoid shape, similar to the first heatmap.
### Detailed Analysis or Content Details
**Heatmap 1 (Left):**
* The highest values (dark red) are concentrated in the upper center and lower center of the image, forming the "head" and "legs" of the humanoid shape.
* The lowest values (dark blue) are located in the central region of the body.
* Approximate value ranges:
* (0.2, 0.8): Values range from approximately -0.5 to 0.8.
* (0.5, 0.2): Values range from approximately -0.5 to 0.8.
* (0.5, 0.8): Values range from approximately -0.5 to 0.8.
**Heatmap 2 (Center):**
* The highest values (dark red) are concentrated in the center of the image.
* The lowest values (dark blue) are located around the edges of the image.
* Approximate value ranges:
* (0.5, 0.5): Approximately 0.7.
* (0.2, 0.2): Approximately 0.2.
* (0.8, 0.8): Approximately 0.2.
**Heatmap 3 (Right):**
* The highest values (dark red) are concentrated in the upper center and lower center of the image, forming the "head" and "legs" of the humanoid shape.
* The lowest values (dark blue) are located in the central region of the body.
* Approximate value ranges:
* (0.2, 0.8): Values range from approximately -0.5 to 0.8.
* (0.5, 0.2): Values range from approximately -0.5 to 0.8.
* (0.5, 0.8): Values range from approximately -0.5 to 0.8.
### Key Observations
* Heatmaps 1 and 3 share a similar distribution pattern, resembling a humanoid shape.
* Heatmap 2 exhibits a different distribution, with a central concentration of high values and lower values towards the edges.
* The color scales are identical across all three heatmaps, allowing for direct visual comparison of the value distributions.
* The humanoid shape in heatmaps 1 and 3 is not perfectly symmetrical.
### Interpretation
The three heatmaps likely represent different data sets or different stages of a process. The humanoid shape in heatmaps 1 and 3 could represent the distribution of a certain attribute (e.g., density, probability) across a human-like form. The difference between the three heatmaps suggests that the underlying data or process has changed, resulting in the different distributions. The elliptical distribution in heatmap 2 could represent a different underlying phenomenon or a different perspective on the same data. The consistent color scale allows for a direct comparison of the magnitude of values across the three distributions. Without further context, it is difficult to determine the specific meaning of the data, but the visual patterns suggest that the data is related to spatial distributions and potentially human-related characteristics.