## Line Chart: NMSE vs. Frequency for Different Rooms
### Overview
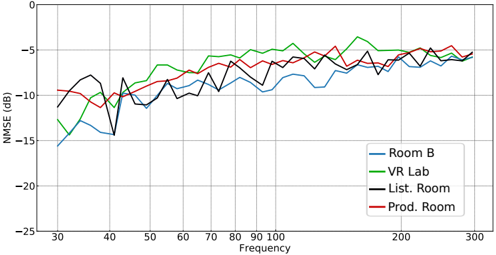
The image is a line chart comparing the NMSE (dB) across different frequencies for four different rooms: Room B, VR Lab, Listening Room, and Production Room. The chart shows how the NMSE varies with frequency for each room.
### Components/Axes
* **X-axis:** Frequency (Hz), with markers at 30, 40, 50, 60, 70, 80, 90, 100, 200, and 300.
* **Y-axis:** NMSE (dB), ranging from -25 to -5, with markers at -25, -20, -15, -10, and -5.
* **Legend (bottom-right):**
* Blue: Room B
* Green: VR Lab
* Black: List. Room (Listening Room)
* Red: Prod. Room (Production Room)
### Detailed Analysis
* **Room B (Blue):** Starts at approximately -15.5 dB at 30 Hz, dips to around -14 dB at 40 Hz, then generally increases to approximately -6 dB at 300 Hz.
* **VR Lab (Green):** Starts at approximately -11 dB at 30 Hz, dips to around -12 dB at 40 Hz, then generally increases to approximately -5.5 dB at 300 Hz.
* **Listening Room (Black):** Starts at approximately -11 dB at 30 Hz, dips sharply to around -14 dB at 42 Hz, then generally increases to approximately -6 dB at 300 Hz.
* **Production Room (Red):** Starts at approximately -9.5 dB at 30 Hz, dips to around -11 dB at 50 Hz, then generally increases to approximately -6 dB at 300 Hz.
### Key Observations
* All four rooms show a general trend of increasing NMSE with increasing frequency.
* The Listening Room experiences a sharp dip in NMSE around 42 Hz.
* The VR Lab generally has a higher NMSE than the other rooms at lower frequencies.
* At higher frequencies (around 300 Hz), the NMSE values for all four rooms converge to approximately -6 dB.
### Interpretation
The chart illustrates the frequency response characteristics of the four different rooms in terms of NMSE. The general upward trend suggests that NMSE tends to increase with frequency across all rooms. The specific dips and variations in each room's curve indicate unique acoustic properties or measurement artifacts within each environment. The convergence of NMSE values at higher frequencies suggests that the rooms may exhibit similar behavior in that range. The sharp dip in the Listening Room's NMSE around 42 Hz could indicate a resonance or other acoustic phenomenon specific to that room.