## Diagram: Directed Acyclic Graph
### Overview
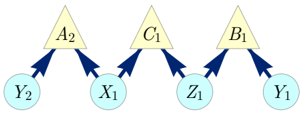
The image depicts a directed acyclic graph (DAG) consisting of nodes represented by triangles and circles, connected by directed edges (arrows). The graph shows dependencies between variables, with arrows indicating the direction of influence.
### Components/Axes
* **Nodes:**
* Triangles: Labeled as A2, C1, and B1. These are positioned at the top of the diagram. The triangles are light yellow.
* Circles: Labeled as Y2, X1, Z1, and Y1. These are positioned at the bottom of the diagram. The circles are light blue.
* **Edges:**
* Directed arrows: Dark blue arrows indicate the direction of influence from the circular nodes to the triangular nodes.
### Detailed Analysis
* **Node A2:** Has incoming edges from nodes Y2 and X1.
* **Node C1:** Has incoming edges from nodes X1 and Z1.
* **Node B1:** Has incoming edges from nodes Z1 and Y1.
* **Node Y2:** Has outgoing edge to node A2.
* **Node X1:** Has outgoing edges to nodes A2 and C1.
* **Node Z1:** Has outgoing edges to nodes C1 and B1.
* **Node Y1:** Has outgoing edge to node B1.
### Key Observations
* The graph is acyclic, meaning there are no directed cycles.
* Each triangular node has two incoming edges from circular nodes.
* The circular nodes have only outgoing edges.
### Interpretation
The diagram represents a causal model where the circular nodes (Y2, X1, Z1, Y1) are independent variables or causes, and the triangular nodes (A2, C1, B1) are dependent variables or effects. The arrows indicate the direction of causality. For example, the value of A2 is influenced by the values of Y2 and X1. This type of graph is commonly used in Bayesian networks and other probabilistic graphical models to represent dependencies between variables.