\n
## Diagram: Heart Failure Diagnostic Pathway
### Overview
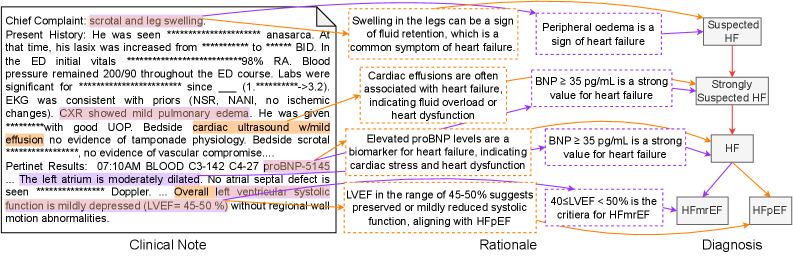
This diagram illustrates a clinical pathway for diagnosing heart failure (HF), linking clinical notes, rationale, and potential diagnoses. It presents a flow of information from patient presentation to diagnostic considerations, with specific biomarkers and clinical findings guiding the diagnostic process. The diagram is divided into three main sections: "Clinical Note" (left), "Rationale" (center), and "Diagnosis" (right).
### Components/Axes
The diagram consists of text blocks connected by arrows indicating a flow of reasoning. The sections are labeled "Clinical Note", "Rationale", and "Diagnosis" at the bottom. The diagram uses color-coding to differentiate diagnostic outcomes: yellow for "Suspected HF", orange for "Strongly Suspected HF", and purple for "HF" (further categorized into HfmrEF and HfPEf).
### Detailed Analysis or Content Details
**Clinical Note (Left Section):**
The clinical note section contains a block of text with the following information:
* **Chief Complaint:** scrotal and leg swelling.
* **Present History:** He was seen anasarca. At that time, his lasix was increased from ***** to ***** BID. In the ED initial vitals *****% RA. Blood pressure remained 200/90 throughout the ED course. Labs were significant for ***** since (1, *****->3.2). EKG was consistent with priors (NSR, NANI, no ischemic changes). CXR showed mild pulmonary edema. He was given ***** with good UOP. Bedside cardiac ultrasound w/mild effusion no evidence of tamponade physiology. Bedside scrotal *****, no evidence of vascular compromise.
* **Pertinent Results:** 07:10AM BLOOD C3-142 C4-27 proBNP-5145. The left atrium is moderately dilated. No atrial septal defect is seen. Doppler... Overall left ventricular systolic function is mildly depressed (LVEF = 45-50%) without regional wall motion abnormalities.
**Rationale (Center Section):**
* Swelling in the legs can be a sign of fluid retention, which is a common symptom of heart failure.
* Cardiac effusions are often associated with heart failure, indicating fluid overload or heart dysfunction.
* Elevated proBNP levels are a biomarker for heart failure, indicating cardiac stress and heart dysfunction.
* LVEF in the range of 45-50% suggests preserved or mildly reduced systolic function, aligning with HFpEF.
**Diagnosis (Right Section):**
* **BNP ≥ 35 pg/mL is a strong value for heart failure** (connected to "Strongly Suspected HF").
* **BNP ≥ 35 pg/mL is a strong value for heart failure** (connected to "HF").
* **40≤LVEF <50% is the criteria for HfmrEF** (connected to "HF").
* **HF** branches into two diagnoses: **HfmrEF** (Heart Failure with mildly Reduced Ejection Fraction) and **HfPEf** (Heart Failure with Preserved Ejection Fraction).
* **Peripheral edema is a sign of heart failure** (connected to "Suspected HF").
**Color Coding & Arrows:**
* Yellow arrows lead from the rationale to "Suspected HF".
* Orange arrows lead from the rationale to "Strongly Suspected HF".
* Purple arrows lead from the rationale to "HF", which then branches to HfmrEF and HfPEf.
### Key Observations
* The diagram emphasizes the importance of clinical findings (edema, effusion), biomarkers (proBNP), and LVEF in the diagnostic process.
* The proBNP level of 5145 is highlighted as a significant finding.
* The LVEF range of 45-50% is specifically linked to HFpEF.
* The diagram shows a progression from initial suspicion to more definitive diagnoses based on accumulating evidence.
### Interpretation
This diagram represents a simplified clinical decision-making process for heart failure. It demonstrates how a combination of subjective clinical observations (swelling) and objective measurements (proBNP, LVEF) are used to arrive at a diagnosis. The branching pathways suggest that the diagnosis is not always straightforward and depends on the specific clinical presentation and test results. The color-coding visually represents the level of certainty in the diagnosis, with yellow indicating initial suspicion and purple indicating a more confident diagnosis. The diagram highlights the importance of considering both systolic and diastolic function in the evaluation of heart failure, as evidenced by the distinction between HfmrEF and HfPEf. The redacted portions of the clinical note suggest sensitive patient information is being protected. The diagram is a useful tool for clinicians to understand the diagnostic pathway and guide their clinical decision-making.