TECHNICAL ASSET FINGERPRINT
8a896a9772c72c17d432bd03
Click to view fullscreen
Press ESC or click to close
FOUND IN PAPERS
EXPERT: healer-alpha-free VERSION 1
RUNTIME: free/openrouter/healer-alpha
INTEL_VERIFIED
## Clinical Flowchart: Heart Failure Diagnosis Pathway
### Overview
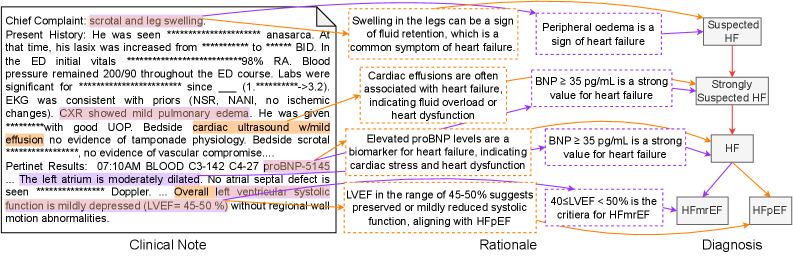
The image is a structured clinical flowchart that maps a patient's presentation from initial symptoms and clinical findings through a diagnostic rationale to a final classification of heart failure. It is divided into three distinct horizontal sections: **Clinical Note** (left), **Rationale** (center), and **Diagnosis** (right). The flow is indicated by purple arrows connecting text boxes and annotations.
### Components/Axes
The diagram is organized into three primary columns or regions:
1. **Clinical Note (Left Region):** Contains the raw patient data and findings.
2. **Rationale (Center Region):** Contains interpretive statements that link clinical findings to diagnostic criteria.
3. **Diagnosis (Right Region):** Contains the final diagnostic classifications.
**Key Visual Elements:**
* **Text Boxes:** Contain the core information.
* **Purple Arrows:** Indicate the logical flow and relationships between elements.
* **Highlighted Text:** Certain phrases within the Clinical Note are highlighted in red or purple, emphasizing key abnormal findings or values.
* **Annotations:** Small text boxes with arrows point to specific parts of the Clinical Note to provide explanatory context (e.g., "Swelling in the legs can be a sign of fluid retention...").
### Detailed Analysis / Content Details
**1. Clinical Note (Left Region)**
* **Chief Complaint:** `scrotal and leg swelling`
* **Present History:** Patient presented with anasarca. At that time, his lasix was increased from `******` to `******`. In the ED, initial vitals: `HR 98% RA`. Blood pressure remained `200/90` throughout the ED course. Labs significant for `creatinine 1.3 -> 3.2`. EKG was consistent with priors (NSR, NANI) no ischemic changes. He was admitted to medicine service with good UOP. Beside cardiac ultrasound showed `world effusion` no evidence of tamponade physiology. Beside scrotal ultrasound, no evidence of vascular compromise.
* **Perinet Results:** `07/10 AM BLOOD C3-142 C4-27 proBNP 345`
* **Impression:** `The left atrium is mildly dilated. No atrial septal defect is seen. Normal Doppler. Overall left ventricular systolic function is mildly depressed (LVEF 45-50 %) without regional wall abnormalities.`
**2. Rationale (Center Region)**
This section contains five interpretive statements, each linked to specific findings:
* `Swelling in the legs can be a sign of fluid retention, which is a common symptom of heart failure.`
* `Peripheral oedema is a sign of heart failure.`
* `Cardiac effusions are often associated with heart failure, indicating fluid overload or heart dysfunction.`
* `Elevated proBNP levels are a biomarker for heart failure, indicating cardiac stress and heart dysfunction.`
* `LVEF in the range of 45-50% suggests preserved or mildly reduced systolic function, aligning with HFpEF.`
**3. Diagnosis (Right Region)**
This section shows a diagnostic decision tree:
* **Top Box:** `Suspected HF` (connected from "Peripheral oedema is a sign of heart failure").
* **Middle Box:** `Strongly Suspected HF` (connected from two rationales: "BNP ≥ 35 pg/mL is a strong value for heart failure" and "BNP ≥ 35 pg/mL is a strong value for heart failure" - note the duplicate rationale text).
* **Central Box:** `HF` (connected from "Strongly Suspected HF" and the rationale about elevated proBNP).
* **Bottom Branching:** `HF` leads to two final classifications:
* `HFmrEF` (connected via the rationale "40<LVEF <50 % is the criteria for HFmrEF").
* `HFpEF` (connected via the rationale about LVEF 45-50% aligning with HFpEF).
### Key Observations
1. **Data Flow:** The diagram explicitly traces the diagnostic reasoning from a symptom (swelling) through objective findings (imaging, labs) to a specific heart failure classification.
2. **Critical Values:** Key numerical thresholds are highlighted:
* `proBNP 345` (pg/mL) is noted as elevated.
* `LVEF 45-50 %` is the central value for classification.
* The rationale mentions `BNP ≥ 35 pg/mL` as a strong indicator, though the patient's value is given as `proBNP 345`.
3. **Diagnostic Criteria:** The flowchart applies specific criteria:
* `HFmrEF` (Heart Failure with mildly Reduced Ejection Fraction) is defined here as `40 < LVEF < 50 %`.
* `HFpEF` (Heart Failure with preserved Ejection Fraction) is associated with the patient's `LVEF 45-50 %`.
4. **Potential Inconsistency:** The rationale box stating "BNP ≥ 35 pg/mL is a strong value for heart failure" appears twice, pointing to the same "Strongly Suspected HF" box. The patient's lab result is for `proBNP` (value 345), not standard BNP. The rationale text may be a general statement, while the patient's specific value (345) is used to support the "Strongly Suspected" status.
5. **Spatial Layout:** The "Clinical Note" is a dense block of text on the left. The "Rationale" statements are arranged vertically in the center, each with an arrow pointing to a specific part of the Clinical Note. The "Diagnosis" tree is on the right, with a top-down flow from "Suspected" to specific classifications.
### Interpretation
This flowchart serves as a visual clinical decision support tool or an educational diagram illustrating the diagnostic pathway for a specific patient case. It demonstrates how disparate clinical data points—symptoms (edema), imaging (mildly dilated left atrium, reduced LVEF), and biomarkers (elevated proBNP)—are synthesized using established medical rationale to arrive at a nuanced diagnosis.
The data suggests the patient presents with clear signs of heart failure (fluid overload, elevated cardiac biomarker, reduced systolic function). The critical interpretation lies in the LVEF value of 45-50%. This value sits in a borderline zone, leading to the dual classification possibility of **HFmrEF** (by one criterion of 40-50%) and **HFpEF** (as it is at the upper end of that range and "preserved" function is often considered ≥50%). The diagram highlights the importance of precise ejection fraction measurement in sub-classifying heart failure, which has implications for treatment strategies. The inclusion of the proBNP value (345) alongside the general rationale about BNP thresholds shows the application of population-based guidelines to an individual case. The overall message is a structured, evidence-based approach to diagnosing and classifying heart failure from initial presentation.
DECODING INTELLIGENCE...