\n
## Line Chart: Execution Time vs. Input Size
### Overview
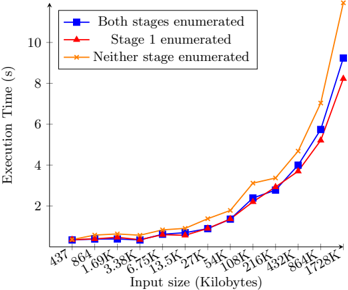
This line chart depicts the relationship between execution time (in seconds) and input size (in kilobytes) for three different enumeration strategies. The chart shows how the execution time increases with increasing input size for each strategy.
### Components/Axes
* **X-axis:** Input size (Kilobytes). Marked with values: 437, 864, 1.69K, 3.38K, 6.75K, 13.5K, 27K, 5.4K, 108K, 216K, 432K, 864K, 1728K.
* **Y-axis:** Execution Time (s). Scale ranges from approximately 0 to 10 seconds.
* **Legend:** Located in the top-left corner. Contains three lines with corresponding labels:
* "Both stages enumerated" (Blue squares)
* "Stage 1 enumerated" (Red triangles)
* "Neither stage enumerated" (Orange diamonds)
### Detailed Analysis
* **Both stages enumerated (Blue):** The line starts at approximately 0.8s at 437KB, increases slowly until around 216KB, then rises sharply to approximately 9.2s at 1728KB. The trend is generally upward, with a steeper slope at larger input sizes.
* 437KB: ~0.8s
* 864KB: ~1.1s
* 1.69K: ~1.2s
* 3.38K: ~1.4s
* 6.75K: ~1.6s
* 13.5K: ~1.8s
* 27K: ~2.1s
* 5.4K: ~2.2s
* 108K: ~2.8s
* 216K: ~3.3s
* 432K: ~4.6s
* 864K: ~6.3s
* 1728K: ~9.2s
* **Stage 1 enumerated (Red):** The line starts at approximately 0.7s at 437KB, increases steadily to approximately 4.4s at 432KB, and then increases rapidly to approximately 8.3s at 1728KB. The trend is also upward, but generally slower than the "Both stages enumerated" line until around 432KB.
* 437KB: ~0.7s
* 864KB: ~0.9s
* 1.69K: ~1.1s
* 3.38K: ~1.3s
* 6.75K: ~1.6s
* 13.5K: ~1.9s
* 27K: ~2.3s
* 5.4K: ~2.4s
* 108K: ~3.1s
* 216K: ~3.8s
* 432K: ~4.4s
* 864K: ~6.7s
* 1728K: ~8.3s
* **Neither stage enumerated (Orange):** The line starts at approximately 0.6s at 437KB, increases gradually to approximately 3.8s at 432KB, and then increases very rapidly to approximately 11.3s at 1728KB. This line consistently shows the highest execution times, especially at larger input sizes.
* 437KB: ~0.6s
* 864KB: ~0.8s
* 1.69K: ~0.9s
* 3.38K: ~1.1s
* 6.75K: ~1.3s
* 13.5K: ~1.6s
* 27K: ~1.9s
* 5.4K: ~2.1s
* 108K: ~2.8s
* 216K: ~3.4s
* 432K: ~3.8s
* 864K: ~5.8s
* 1728K: ~11.3s
### Key Observations
* The execution time increases with input size for all three enumeration strategies.
* "Neither stage enumerated" consistently exhibits the longest execution times, particularly as the input size grows.
* "Both stages enumerated" and "Stage 1 enumerated" have similar performance for smaller input sizes, but "Both stages enumerated" becomes more efficient at larger input sizes.
* The increase in execution time appears to be exponential for all strategies as input size increases beyond 432KB.
### Interpretation
The data suggests that enumerating stages in the process significantly impacts execution time, especially for larger input sizes. The strategy of enumerating neither stage is the least efficient, indicating that enumeration provides a performance benefit. The fact that "Both stages enumerated" outperforms "Stage 1 enumerated" at larger input sizes suggests that enumerating both stages provides a more scalable solution. The exponential increase in execution time with input size indicates a potential bottleneck or algorithmic complexity that becomes more pronounced as the input grows. This could be due to the overhead of enumeration becoming more significant with larger datasets, or due to the underlying algorithm's time complexity. The chart highlights the importance of choosing an appropriate enumeration strategy to optimize performance, particularly when dealing with large input sizes. The data points suggest that the performance difference between the strategies is negligible for very small inputs, but becomes substantial as the input size increases.