## Bar Charts: Energy per MAC for VGG19 and YOLOv3 Across Node Sizes
### Overview
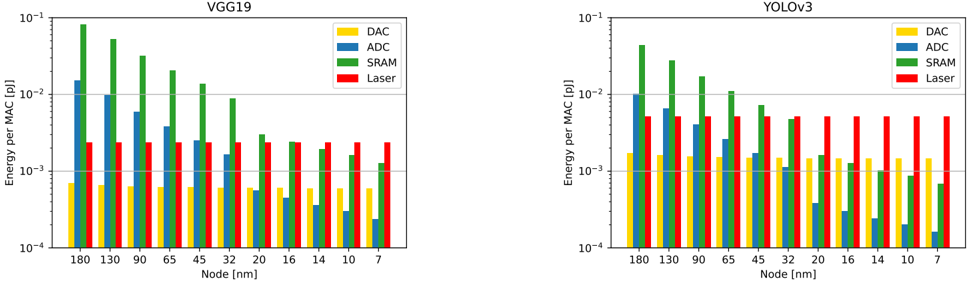
The image contains two side-by-side bar charts comparing energy consumption per MAC (Multiply-Accumulate operation) for four technologies (DAC, ADC, SRAM, Laser) across varying semiconductor node sizes (7 nm to 180 nm). The y-axis uses a logarithmic scale (10⁻⁴ to 10⁻¹ pJ), and the x-axis lists node sizes in descending order.
---
### Components/Axes
- **X-axis (Node Size [nm])**: 180, 130, 90, 65, 45, 32, 20, 16, 14, 10, 7 nm.
- **Y-axis (Energy per MAC [pJ])**: Logarithmic scale from 10⁻⁴ to 10⁻¹ pJ.
- **Legend**:
- Yellow: DAC (Digital-to-Analog Converter)
- Blue: ADC (Analog-to-Digital Converter)
- Green: SRAM (Static Random-Access Memory)
- Red: Laser
- **Placement**: Legend is centered-right in both charts. Node labels are bottom-aligned, and energy values are left-aligned.
---
### Detailed Analysis
#### VGG19 Chart
- **DAC (Yellow)**:
- Energy decreases from ~3×10⁻³ pJ (180 nm) to ~1×10⁻⁴ pJ (7 nm).
- Trend: Steady decline with node size.
- **ADC (Blue)**:
- Energy starts at ~1×10⁻² pJ (180 nm) and drops to ~1×10⁻⁴ pJ (7 nm).
- Trend: Sharpest decline between 180 nm and 90 nm.
- **SRAM (Green)**:
- Energy peaks at ~1×10⁻¹ pJ (180 nm) and falls to ~1×10⁻³ pJ (7 nm).
- Trend: Gradual reduction, remaining the highest across all nodes.
- **Laser (Red)**:
- Energy remains flat at ~1×10⁻³ pJ across all nodes.
- Trend: Constant, lowest among all technologies.
#### YOLOv3 Chart
- **DAC (Yellow)**:
- Energy decreases from ~1×10⁻³ pJ (180 nm) to ~1×10⁻⁴ pJ (7 nm).
- Trend: Similar to VGG19 but starts lower.
- **ADC (Blue)**:
- Energy starts at ~1×10⁻² pJ (180 nm) and drops to ~1×10⁻⁵ pJ (7 nm).
- Trend: More pronounced decline than VGG19.
- **SRAM (Green)**:
- Energy peaks at ~1×10⁻¹ pJ (180 nm) and falls to ~1×10⁻³ pJ (7 nm).
- Trend: Matches VGG19 but with slightly higher values at intermediate nodes (e.g., 65 nm).
- **Laser (Red)**:
- Energy remains flat at ~1×10⁻³ pJ across all nodes.
- Trend: Identical to VGG19.
---
### Key Observations
1. **SRAM Dominance**: SRAM consistently consumes the most energy per MAC in both models, even at 7 nm.
2. **Laser Efficiency**: Laser technology shows the lowest energy consumption, remaining constant across all nodes.
3. **Node Scaling Impact**: Energy consumption decreases with smaller nodes, but SRAM’s reduction is less steep compared to DAC/ADC.
4. **Model Differences**: YOLOv3’s ADC energy is lower than VGG19’s at smaller nodes (e.g., 7 nm: 1×10⁻⁵ vs. 1×10⁻⁴ pJ).
---
### Interpretation
- **Technology Trade-offs**: SRAM’s high energy cost suggests it may be a bottleneck for energy-efficient AI hardware, even at advanced nodes. Laser technology’s stability and low energy use indicate potential for future optimization.
- **Model Architecture**: YOLOv3’s lower ADC energy at smaller nodes implies better analog/digital integration compared to VGG19.
- **Logarithmic Scale Insight**: The logarithmic y-axis emphasizes relative differences, highlighting SRAM’s disproportionate energy burden.
This data underscores the need for architectural innovations to mitigate SRAM’s energy impact while leveraging emerging technologies like lasers for sustainable AI hardware.