## Line Chart: Off-Policy GRPO Performance
### Overview
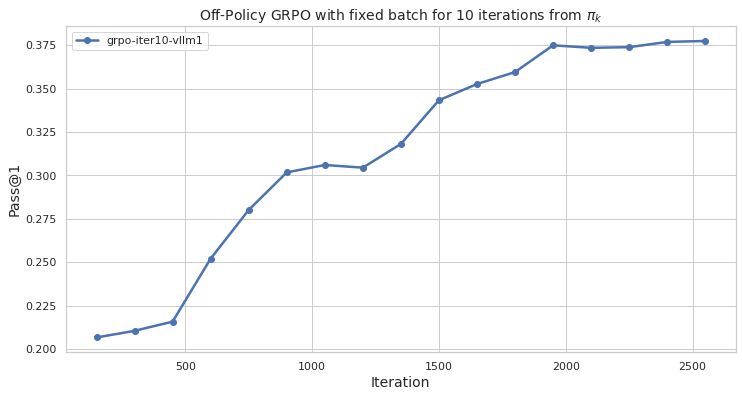
This image displays a line chart tracking the performance of an "Off-Policy GRPO" (Group Relative Policy Optimization) model. The chart plots the "Pass@1" metric (a common evaluation metric for Large Language Models, representing the probability that the first generated sample is correct) against training "Iteration". The data shows a generally upward trend, indicating model improvement over time.
### Components/Axes
* **Chart Title:** "Off-Policy GRPO with fixed batch for 10 iterations from $\pi_k$" (Note: $\pi_k$ represents the policy at iteration $k$).
* **Y-Axis:** Labeled "Pass@1". The scale ranges from 0.200 to 0.375, with major grid lines at 0.025 intervals.
* **X-Axis:** Labeled "Iteration". The scale ranges from 0 to 2500+, with major grid lines at 500-unit intervals.
* **Legend:** Located in the top-left corner. It contains a single entry: "grpo-iter10-vllm1", represented by a blue line with circular markers.
### Detailed Analysis
The chart plots a single data series ("grpo-iter10-vllm1"). The trend is generally monotonic increasing, with distinct phases of acceleration and deceleration.
**Data Point Extraction (Approximate values based on visual grid alignment):**
| Iteration (x) | Pass@1 (y) | Trend Description |
| :--- | :--- | :--- |
| ~150 | ~0.208 | Starting point |
| ~300 | ~0.212 | Slow, steady growth |
| ~450 | ~0.216 | Slow, steady growth |
| ~600 | ~0.252 | **Acceleration phase begins** |
| ~750 | ~0.280 | Steep upward slope |
| ~900 | ~0.302 | Steep upward slope |
| ~1050 | ~0.306 | Plateau/Stagnation |
| ~1200 | ~0.305 | Slight dip/Plateau |
| ~1350 | ~0.318 | Resumed growth |
| ~1500 | ~0.344 | Steep upward slope |
| ~1650 | ~0.353 | Gradual growth |
| ~1800 | ~0.360 | Gradual growth |
| ~1950 | ~0.375 | **Saturation phase begins** |
| ~2100 | ~0.373 | Minor fluctuation |
| ~2250 | ~0.374 | Minor fluctuation |
| ~2400 | ~0.377 | Marginal gains |
| ~2550 | ~0.378 | Marginal gains |
### Key Observations
* **Initial Phase (0–450):** The model shows very slow improvement, suggesting a "warm-up" period or initial difficulty in learning the task.
* **Rapid Improvement (450–900):** A significant performance jump occurs here, where the Pass@1 metric increases from ~0.216 to ~0.302.
* **Stagnation/Plateau (900–1200):** The model hits a temporary ceiling where performance flattens out, potentially indicating a local optimum or a need for policy adjustment.
* **Secondary Growth (1200–1950):** The model breaks through the plateau, showing strong, consistent improvement.
* **Saturation (1950–2550):** The curve flattens significantly after iteration 1950, suggesting the model has reached near-convergence or the limits of the current training configuration.
### Interpretation
The data demonstrates a successful training run for an LLM using Off-Policy GRPO. The "Pass@1" metric is a standard benchmark for reasoning or coding tasks; the improvement from ~0.20 to ~0.38 represents a nearly 90% relative increase in performance over the course of 2500 iterations.
The presence of the plateau between iterations 900 and 1200 is a classic characteristic of reinforcement learning training curves, often representing the model "struggling" to generalize before finding a more effective policy strategy. The fact that the curve resumes its upward trajectory after this point suggests the training process is robust. The final saturation indicates that further training iterations may yield diminishing returns, and the model is likely ready for evaluation or deployment.