## Bar Chart: Prediction Flip Rate Comparison for Llama-3.2-1B and Llama-3.2-3B
### Overview
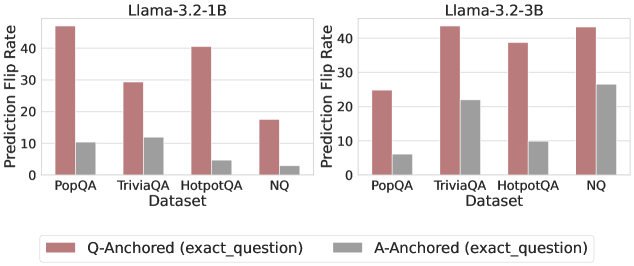
The image presents two bar charts comparing the prediction flip rates of two language models, Llama-3.2-1B and Llama-3.2-3B, across four different datasets: PopQA, TriviaQA, HotpotQA, and NQ. The charts compare "Q-Anchored" (exact question) and "A-Anchored" (exact question) scenarios, represented by different colored bars.
### Components/Axes
* **Chart Titles:** "Llama-3.2-1B" (left chart) and "Llama-3.2-3B" (right chart).
* **Y-axis Title:** "Prediction Flip Rate".
* **Y-axis Scale:** 0 to 50, with tick marks at 0, 10, 20, 30, 40.
* **X-axis Title:** "Dataset".
* **X-axis Categories:** PopQA, TriviaQA, HotpotQA, NQ.
* **Legend:** Located at the bottom of the image.
* **Rose/Pink Bars:** "Q-Anchored (exact\_question)".
* **Gray Bars:** "A-Anchored (exact\_question)".
### Detailed Analysis
**Llama-3.2-1B (Left Chart):**
* **PopQA:**
* Q-Anchored: Approximately 46.
* A-Anchored: Approximately 10.
* **TriviaQA:**
* Q-Anchored: Approximately 29.
* A-Anchored: Approximately 12.
* **HotpotQA:**
* Q-Anchored: Approximately 40.
* A-Anchored: Approximately 5.
* **NQ:**
* Q-Anchored: Approximately 17.
* A-Anchored: Approximately 3.
**Llama-3.2-3B (Right Chart):**
* **PopQA:**
* Q-Anchored: Approximately 25.
* A-Anchored: Approximately 6.
* **TriviaQA:**
* Q-Anchored: Approximately 43.
* A-Anchored: Approximately 22.
* **HotpotQA:**
* Q-Anchored: Approximately 39.
* A-Anchored: Approximately 10.
* **NQ:**
* Q-Anchored: Approximately 43.
* A-Anchored: Approximately 27.
### Key Observations
* For Llama-3.2-1B, the Q-Anchored flip rates are significantly higher than the A-Anchored flip rates across all datasets.
* For Llama-3.2-3B, the difference between Q-Anchored and A-Anchored flip rates is less pronounced, especially for TriviaQA and NQ.
* Llama-3.2-1B shows the highest Q-Anchored flip rate for PopQA, while Llama-3.2-3B shows the highest Q-Anchored flip rate for TriviaQA and NQ.
* The A-Anchored flip rates are generally low for both models across all datasets, but are higher for Llama-3.2-3B.
### Interpretation
The charts illustrate the prediction flip rates of two Llama models under different anchoring conditions. The "Q-Anchored" scenario, where the exact question is used, generally results in higher flip rates compared to the "A-Anchored" scenario, where the exact answer is used. This suggests that the models are more sensitive to perturbations in the question than in the answer.
The differences between Llama-3.2-1B and Llama-3.2-3B indicate that the larger model (3B) exhibits a different behavior, with a smaller gap between Q-Anchored and A-Anchored flip rates, and higher A-Anchored flip rates overall. This could imply that the larger model is more robust to answer-based perturbations or that it relies more on the answer context.
The variations across datasets suggest that the models' sensitivity to perturbations depends on the specific characteristics of each dataset. For example, both models show relatively high Q-Anchored flip rates for TriviaQA and HotpotQA, indicating that these datasets may be more challenging in terms of question understanding or reasoning.