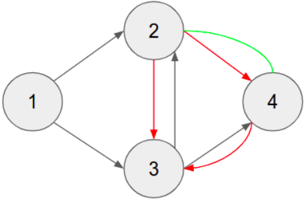
## Diagram: Directed Graph with Colored Edges
### Overview
The image depicts a directed graph consisting of four nodes labeled 1, 2, 3, and 4. The nodes are connected by edges, some of which are colored differently (gray, red, and green) to indicate different relationships or properties.
### Components/Axes
* **Nodes:** Four nodes labeled 1, 2, 3, and 4, arranged in a roughly diamond shape.
* **Edges:** Directed edges (arrows) connecting the nodes. The edges are colored gray, red, or green.
### Detailed Analysis
* **Node 1:**
* Has a gray edge directed towards Node 2.
* Has a gray edge directed towards Node 3.
* **Node 2:**
* Has a gray edge directed towards Node 4.
* Has a red edge directed towards Node 3.
* Has a green edge directed towards Node 4.
* **Node 3:**
* Has a gray edge directed towards Node 2.
* Has a red edge directed towards Node 4.
* **Node 4:**
* Has a gray edge directed towards Node 3.
* Has a red edge directed towards Node 4 (self-loop).
### Key Observations
* The graph is directed, meaning the edges have a specific direction.
* The colors of the edges (gray, red, green) likely represent different types of relationships or properties between the nodes.
* Node 4 has a self-loop (an edge that starts and ends at the same node).
### Interpretation
The diagram represents a network or system with four components (nodes) and relationships (edges) between them. The colors of the edges could represent different types of interactions, strengths of connections, or other properties. The self-loop on Node 4 indicates a feedback mechanism or a recurring process within that component. Without further context, the specific meaning of the colors and the overall purpose of the graph cannot be determined.